
Figure 3.
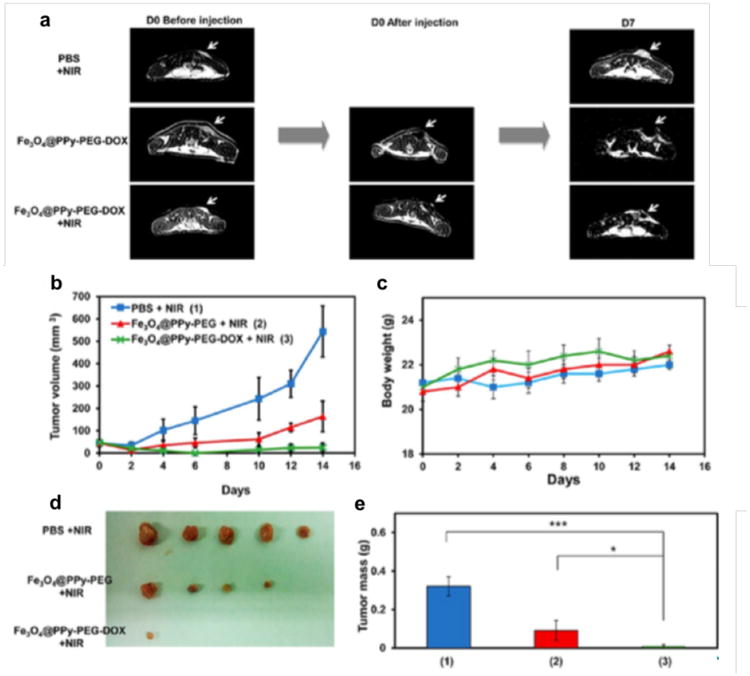
(a) Representative MR images of mice from three different groups obtained at day 0 before and after injection and day 7 after treatment (tumors marked by the white arrow). (b) Tumor growth curves of different groups of mice after various treatments indicated (n = 5). (c) Body weights of mice after various treatments indicated. (d) Photos of the tumors collected from different groups of mice at day 14. (e) Average weights of tumors collected from mice at the end of various treatments indicated. Error bars are based on SEM (***p < 0.001, **p < 0.01, or *p < 0.05, by ANOVA with Tukey's post-test). Reprinted with permission from American Chemical Society [53].