
Fig. 6. Chromosome fragmentation analysis by RNase HI, RNase HII and RNase A treatment in vitro.
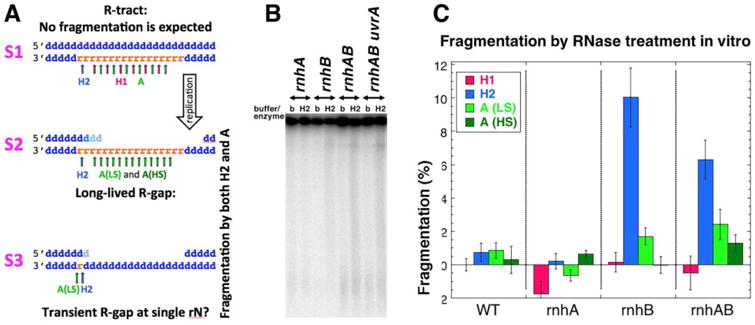
A. A scheme of various hypothetical R-lesions (R-tract, two types of R-gaps) with positions of cleavage by RNase HI, HII and A (in low salt (LS) and high salt (HS) conditions) shown with arrows of the corresponding color. Small blue “d” letters, dNs; small orange “r” letters, rNs. The strand polarity in a duplex is identified on the left. B. A representative pulsed-field gel detecting chromosomal fragmentation after RNase HII treatment. The lanes are marked either with “b” (buffer treatment control) or “H2” (RNase HII treatment). Strains: WT, AB1157; rnhA, L-413; rnhB, L-415; rnhAB, L-416; uvrA rnhAB, L-417. C. Quantification of the RNase treatment-induced fragmentation. The plotted values are means ± SEM from 3-6 independent measurements from gels like in “B”. For RNase A treatment, both low salt (LS) and high salt (HS) conditions are plotted. Since individual fragmentation values are differences between the enzyme and the buffer treatments, some values are negative.