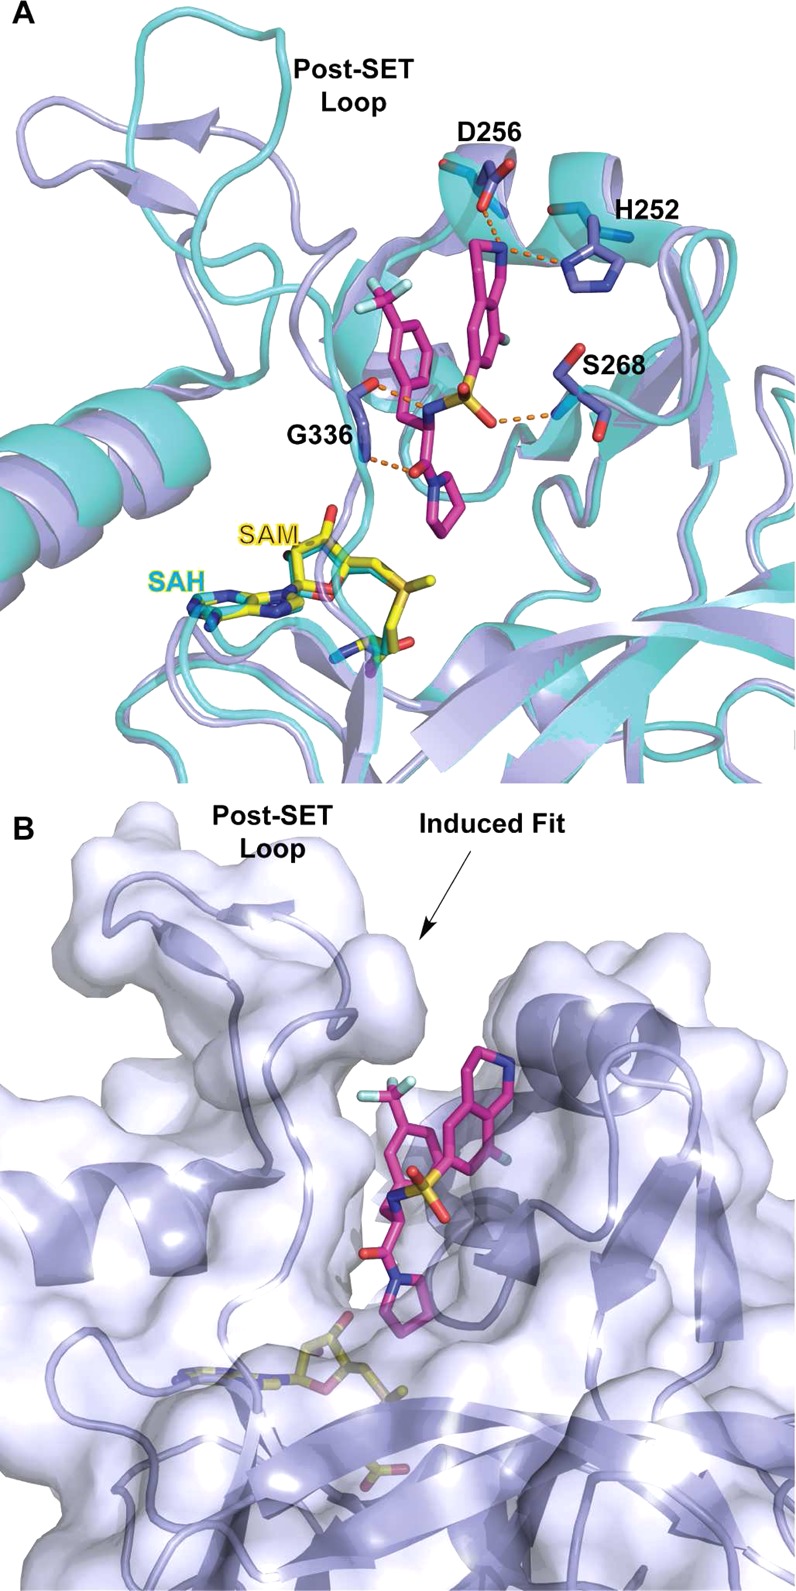
Figure 9.

(A) SETD7 (light blue) in complex with (R)-PFI-2 (magenta) and SAM (yellow) (PDB ID: 4JLG) is superimposed with SETD7 structure in complex with SAH (1O9S) depicting the conformational variability of the post-SET loop. Hydrogen bonds are represented as orange dashed lines with key residues. (B) Surface representation of (R)-PFI-2-bound SETD7 highlighting an induced conformational modification of the post-SET loop.
