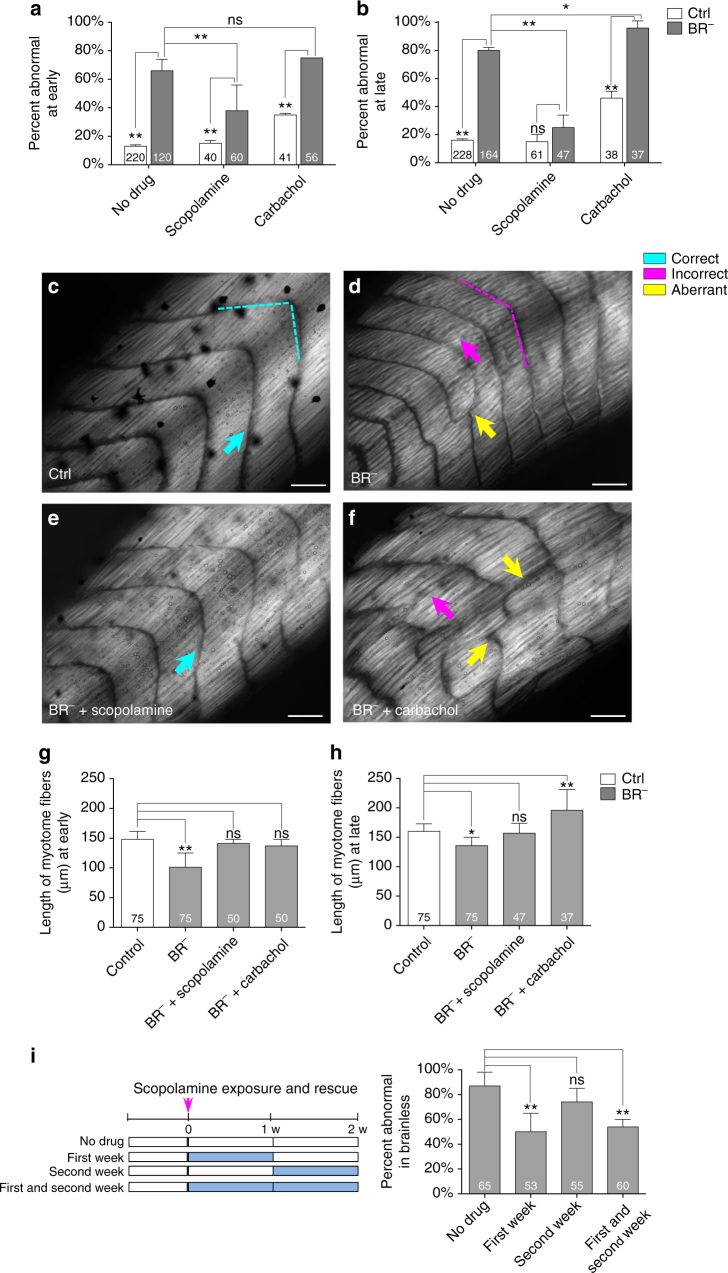
Fig. 2.
Scopolamine rescues the BR− muscle phenotype. a, b Quantification of the mean percentage of abnormal embryos and statistical comparisons among Ctrl and BR− populations under normal conditions and after drug treatment, at early- (a) and late- (b) stages after brain removal. Values are plotted as mean % ± s.d. (no-pooled data from, at least, three different replicates). c–f. Typical muscle phenotype for Ctrl (c) and BR− (d), and BR− after scopolamine (e) or carbachol treatment (f), as seen under polarized light. Rostral is upper right and dorsal is up. Turquoise, magenta and yellow arrows indicate correct, incorrect and aberrant formation, respectively. Scale bar, 100 μm. g, h Quantification of the mean length of myotome fibers and statistical comparisons among untreated Ctrl and untreated BR−, scopolamine-treated BR− and carbachol-treated BR− at early- (g, one-way ANOVA, P < 0.01) and late- (h, Kruskal–Wallis test, P < 0.01) stages after brain removal. No significant differences after a posteriori analysis were detected among the different Ctrl groups. Data represent the mean and s.d. of three independent replicates. i. Scopolamine exposure and rescue effects on BR− phenotype. (left) Graphical representation of the different exposure times to scopolamine in BR−, after brain removal (t = 0, magenta arrow; white band means no drug and blue bands means drug treatment) and for a 2-week (2w) period. First-week experimental group was exposed to scopolamine immediately after brain removal and consecutively for the first week. Second-week animals were exposed to the drug 1 week after the brain removal, for 1-week period. First- and second-week animals were exposed to scopolamine immediately after the brain removal and for the 2 next consecutive weeks. (right) Quantification of the mean percentage of embryos with abnormal phenotype within each BR− group. Values are plotted as mean % ± s.d. (no-pooled data from three different replicates). For all panels, number in bars indicates n or number of embryos analyzed for each group. P values after z-test a, b, i and post-hoc Bonferroni’s g or Dunn’s test h are indicated as **P < 0.01, *P < 0.05, ns P > 0.05

