Figure 6.
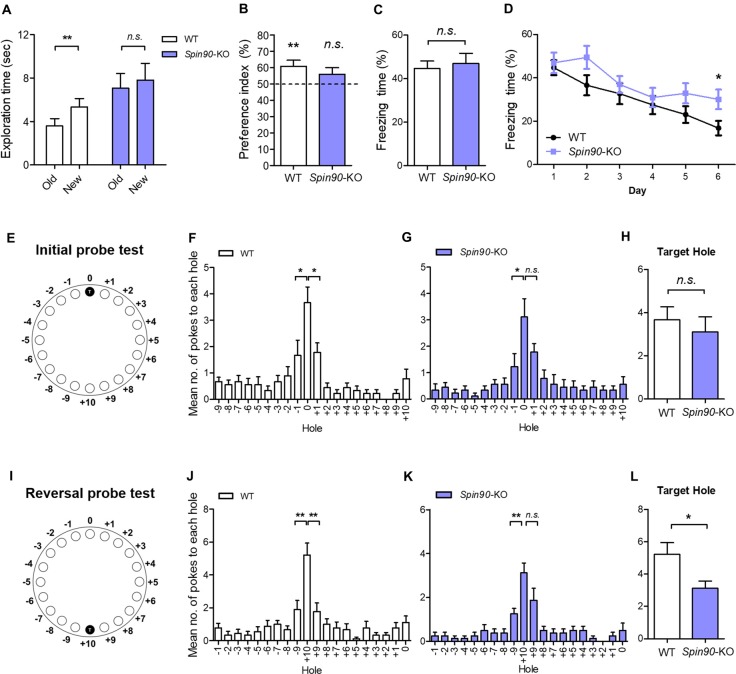
Behavioral flexibility is reduced in Spin90-KO mice. (A,B) Object-place recognition test. (A) Placed novel object is termed “new” vs. the familiar “old”. (B) Preference for exploring new object vs. old object is assessed in WT (n = 20; **p < 0.01) and Spin90-KO mice (n = 16; p = 0.3819). (C,D) Fear conditioning and fear extinction paradigm. Freezing levels indicative of fear memory were assessed on day 1 after training in WT and Spin90-KO mice. Extinction tests were performed up to day 6 after training and freezing levels were compared between both genotypes (n = 13 for both; p = 0.7030, *p < 0.05). (E–H) Initial learning in Barnes maze test. (E) Position of the target hole during initial learning is marked T (0). (F) Probe tests were taken to examine WT and Spin90-KO mice ability to find target hole, indicated by number of nose pokes. Mean number of pokes to each hole adjacent to the target hole suggests proper learning was achieved. WT mice (n = 9) showed higher number of nose pokes to target (0) hole vs. −1 hole (unpaired t test, *p < 0.05) and +1 hole (unpaired t test, *p < 0.05). (G) Spin90-KO mice (n = 9) showed higher number of nose pokes to target (0) hole only vs. −1 hole (unpaired t test, *p < 0.05). (H) No significant differences were found in ability to find target hole (unpaired t-test, n.s., p = 0.5542). (I–L) Reversal learning in Barnes maze test. (I) Position of the new target hole during reversal learning is marked as T (+10). (J) Probe tests were taken to differentiate WT and Spin90-KO mice ability to find target hole in new location. WT (n = 9) showed higher number of nose pokes to target (+10) hole vs. −9 hole (unpaired t test, **p < 0.01) and +9 hole (unpaired t test, **p < 0.01). (K) Spin90-KO (n = 8) showed higher number of nose pokes to target (+10) hole only vs. +9 hole (unpaired t test, **p < 0.01). (L) Spin90-KO showed significantly less number of nose poking into the target hole (unpaired t-test, *p < 0.05). All data are expressed as mean ± SEM.

