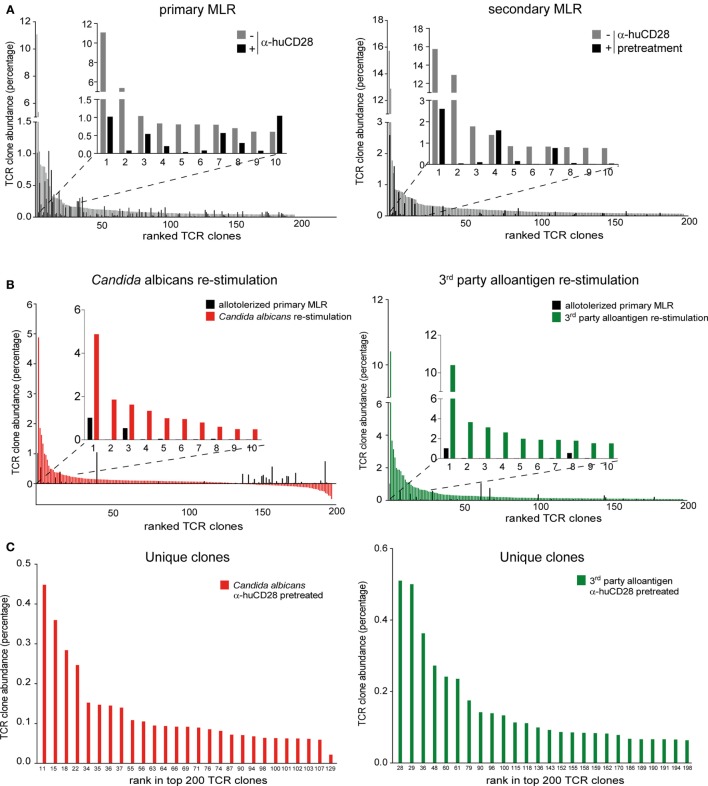
Figure 6.
Expansion of allo- versus pathogen-reactive T-cell clones after α-huCD28-mediated blockade. Clonal frequency of CD3+ T-cell cultures from a primary recipient–donor pair mixed leukocyte reaction (MLR) and re-stimulation with either 1st party alloantigen, Candida albicans, or third-party alloantigen, as analyzed by deep TCRβ sequencing. (A) Expansion of T-cell clones in a primary MLR without (gray bars) or with α-huCD28 (black bars) and a secondary MLR in the absence of α-huCD28. Top 200 clones are ranked from their lowest to highest frequency in cultures without α-huCD28. The top 10 clones are represented individually in all graphs. (B) Clonal expansion after allo-tolerization and re-stimulation with C. albicans or third-party alloantigen. The frequency of antigen-independent expanded T-cell clones (T-cells stimulated with autologous DCs without C. albicans) was subtracted from the Candida-specific clonal expansion. The top 200 clones were ranked from high to low abundance in C. albicans (red bars) or third-party alloantigen (green bars) re-stimulation cultures and compared to allo-tolerized primary MLRs (black bars). For an in depth investigation, the top 10 most expanded clones are represented individually in all graphs. Clone numbers 2 and 4–10 (left graph) and 2–7 and 9–10 (right graph) are present in primary MLRs, but in low numbers ranging from 0.004 to 0.039%. (C) Unique clones expanded upon stimulation with C. albicans (red bars) or third-party alloantigen (green bars) but not present in secondary MLRs with 1st party alloantigen. Clones are ranked from high-to-low abundance in the top 200 clonal repertoire (numbers at the bottom of the figure).

