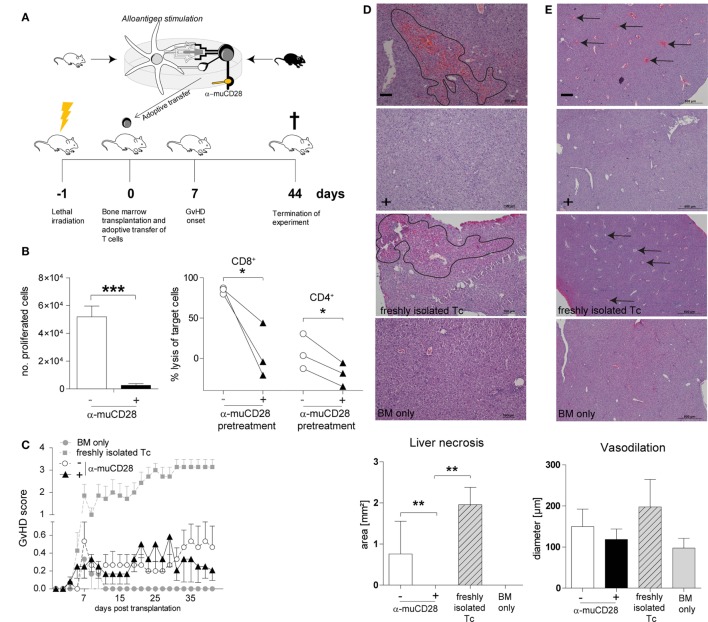
Figure 7.
Ex vivo co-stimulation blocked T-cells do not induce graft-versus-host disease (GvHD) in an MHC-mismatched murine model. Experimental schema (A): T-cells isolated from C56BL/6 spleens were co-cultured with BALB/c dendritic cells (DCs) for 5 days with or without α-muCD28. Lethally irradiated BALB/c mice were transplanted with C56BL/6 bone marrow (BM) and FACS-sorted viable T-cells from mixed leukocyte reaction (MLR) cultures. Mice were monitored for signs of GvHD for 44 days. (B) T-cell proliferation: depicted by the number of proliferated C56BL/6 T-cells upon stimulation with BALB/c DCs together with (+) or without (−) α-muCD28 after a 5-day MLR (left graph), before infusion; cytolytic activity: cytotoxicity of alloreactive CD8+ and CD4+ T-cells (right graph) against MC38 target cells after 21 h is shown. (C) GvHD score of BALB/c mice transplanted with C57BL/6 BM alone (●, n = 6) or together with non-tolerant (freshly isolated) T-cells (■, n = 7), or T-cells without (○, n = 15) or with prior α-muCD28 treatment ex vivo (▲, n = 12). (D) H&E staining of BALB/c livers, necrotic lesions are indicated by black borders, 10× magnification. Necrosis was assessed by quantifying the affected areas using the ImageJ program (− α-muCD28 n = 11, + α-muCD28 n = 11, freshly isolated Tc n = 5, and BM only n = 6). Outliers were removed by applying Grubbs’ test (alpha = 0.1). The sum of the areas of all measurable lesions in a high power field is depicted. Bars represent 100 µm. (E) Dilated blood vessels are indicated by black arrows, 4× magnification. Vasodilation was quantified as the mean of all vessel diameters in a high power field (− α-muCD28 n = 11, + α-muCD28 n = 10, freshly isolated Tc n = 4, BM only n = 4). Outliers were removed by applying Grubbs’ test (alpha = 0.1). Bars represent 500 µm. Image acquisition in (D,E) was done with a Nikon Eclipse 80i microscope with a build on camera Nikon DS-Fi1. Magnification of the object lenses was 500 μm = 4×, 100 μm = 10×. NIS-Elements F4.30.00 software was used for image acquisition. Data shown comprise two separate experiments, scored in a blinded fashion independently by two observers. **p < 0.005, *p < 0.05.

