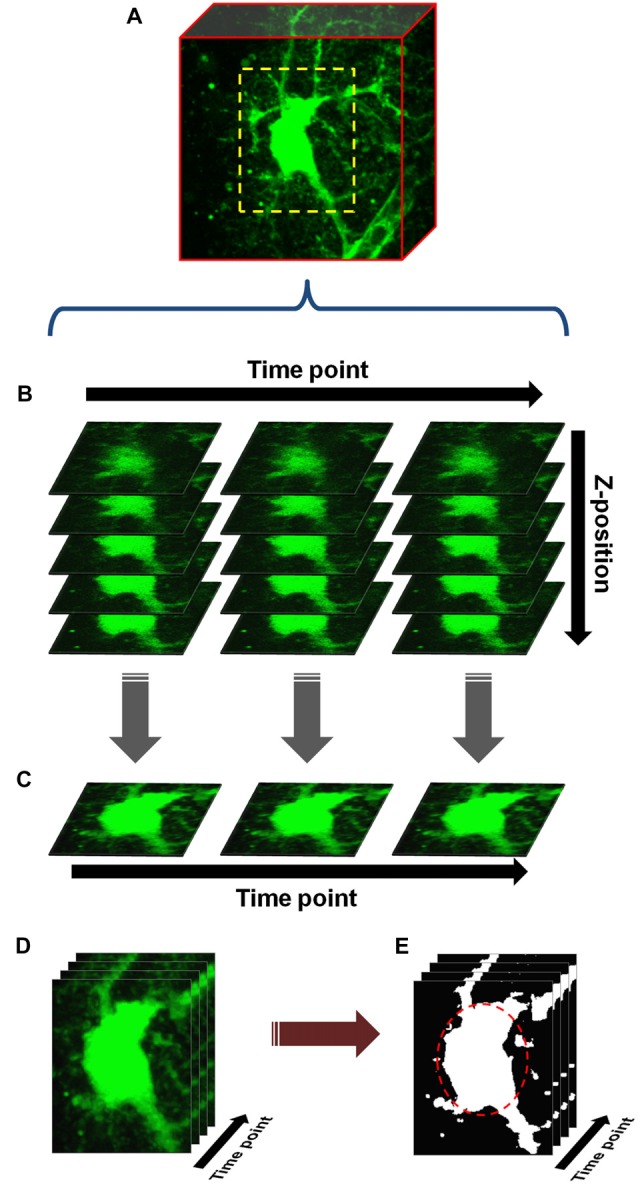
Figure 1.

Basic protocol for cell volume analysis. (A) An astrocyte or neuron, fluorescently labeled by patch clamp or other means, is chosen and a scanning region (dashed yellow box) selected which closely encompasses the soma. Starting with baseline (measurement taken in normosmolar ACSF (nACSF) prior to hypoosmolar ACSF (hACSF) application), z-stacks are taken through the soma at 1 min intervals. During analysis, these stacks (x-y-z) are concatenated into a time-series (x-y-z-t) hyperstack (B). The hyperstack is filtered and collapsed in the z-axis to produce a time series (x-y-t) composed of max-intensity projections (MIPs) (C). After alignment, cropping and background subtraction are performed on this series, the resulting “processed” time series (D) is finally thresholded to produce a binary image series (E). An elliptical region of interest (ROI; dashed red oval) is drawn around the soma, and any pixels above threshold within this ROI are quantified.
