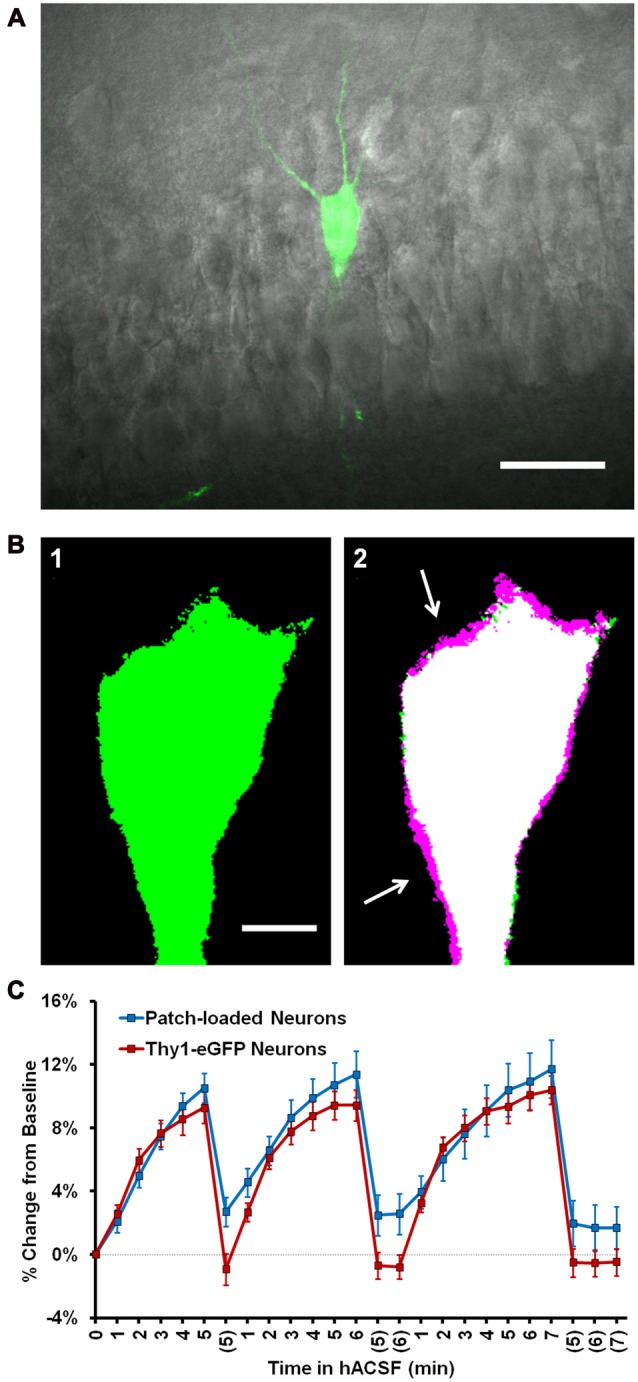
Figure 3.

Neuronal swelling persists in Thy1-enhanced green fluorescent protein (eGFP) neurons. (A) Merged infrared (IR) and fluorescent images from a section of the CA1 pyramidal layer in a typical Thy1-eGFP hippocampal slice. GFP-positive neurons are random and generally very sparse, as shown here. (B) Representative thresholded images depicting a Thy1-eGFP neuron at standard imaging depth (~30–40 μm deep) at baseline (B1) and 5 min 40% hACSF time points (B2). Baseline image is overlaid in (B2) to reveal soma size increases (magenta regions, indicated by white arrows). (C) Volume change in neurons exposed to 40% hACSF, labeled either by patch clamp dialysis of dye (“Patch loaded”, Alexa Fluor 488 or 594 hydrazide) or by expression of eGFP.
