Figure 7.
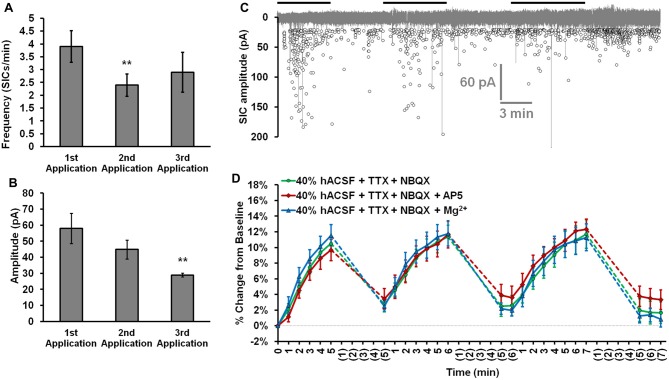
Neuronal swelling is not due to NMDA receptor activation. (A) Average SIC frequency and (B) amplitude during each application of 40% hACSF; **p < 0.01 vs. 1st application. (C) Aggregated representation of SIC activity over a typical course of hACSF treatment. Black bars above the trace indicate periods of 40% hACSF. Background trace (gray) shows a voltage-clamp recording of NMDA receptor activity from a typical CA1 pyramidal neuron during 40% hACSF application, while foreground scatterplot shows the overall distribution of SIC activity across all neurons over time (n = 11). (D) Neuron soma area measured as percent change from baseline over multiple applications of standard 40% hACSF (containing 10 μM NBQX and 1 μM TTX, to match conditions in which SICs are observed), 40% hACSF + 50 μM AP5, or 40% hACSF + 6 mM Mg2+. Time points in (C,D) are vertically aligned to facilitate comparison of neuronal SICs and volume changes. Neither AP5 nor high Mg2+ were effective in blocking neuronal swelling.

