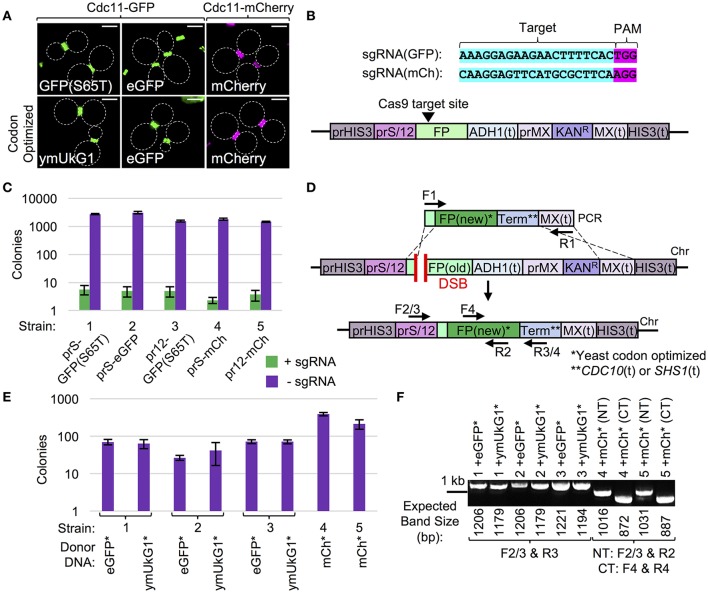
Figure 5.
Cas9-based strategy for upgrading fluorescent markers. (A) Yeast (GFY-42 or GFY-330) were transformed with vectors (pGF-IVL1419 to pGF-IVL1424) expressing a fusion of the CDC11 septin to one of six GFP or mCherry variants and imaged by fluorescence microscopy. White dotted lines, cell periphery. Scale bar, 3 μm. (B) Three FP genes (GFP(S65T), eGFP, or mCherry) were integrated at the HIS3 locus under one of two promoters with a drug-resistance marker (bottom). Two sgRNA cassettes were built (top) to target Cas9 to a target sequence in GFP or mCherry (Figure S3). (C) Yeast strains GFY-2613, GFY-2615, GFY-2617, GFU-2621, and GFY-2622 (labeled 1–5) containing the Cas9 vector (pGF-V789) were transformed with either an empty (pRS425), sgRNA(GFP) (pGF-425+IVL1276), or sgRNA(mCherry) (pGF-425+IVL1277) plasmid, plated on SD-URA-LEU, and the number of colonies was quantified in triplicate. Error, SD. (D) A marker-less integration strategy to replace one FP with a different fluorescent variant and/or a codon optimized version of the same FP gene. Donor DNA included codon optimized eGFP (from pGF-IVL1251), coral ymUkG1 (pGF-IVL1253), or mCherry (pGF-IVL1255). A unique terminator sequence for each donor construct allowed HR to only occur within (i) common 30 bp upstream FP coding sequences and (ii) the MX(t). (E) Donor PCRs were amplified from (D) using universal primers (F1, “GFP clone out F”/“mCherry clone out F” and R1, “MX clone out R2”) and digested with DpnI. Equimolar amounts were co-transformed into yeast strains 1–5 (C) with the appropriate sgRNA vector, plated to SD-URA-LEU, and the colony count was quantified in triplicate. Error, SD. (F) Randomly selected isolates were tested for survival on G418 and yeast lacking the KanR cassette (n = 2) were assayed by both diagnostic PCR and DNA sequencing. For strains (1–3), PCRs (F2/3 and R3) utilized DNA primers to the promoter and newly introduced terminator sequences. For strains (4–5), two diagnostic PCRs (F2/3 and R2, F4, and R4) were performed to confirm proper integration (see Table S1). The expected fragment size (bp) is illustrated.

