Figure 6.
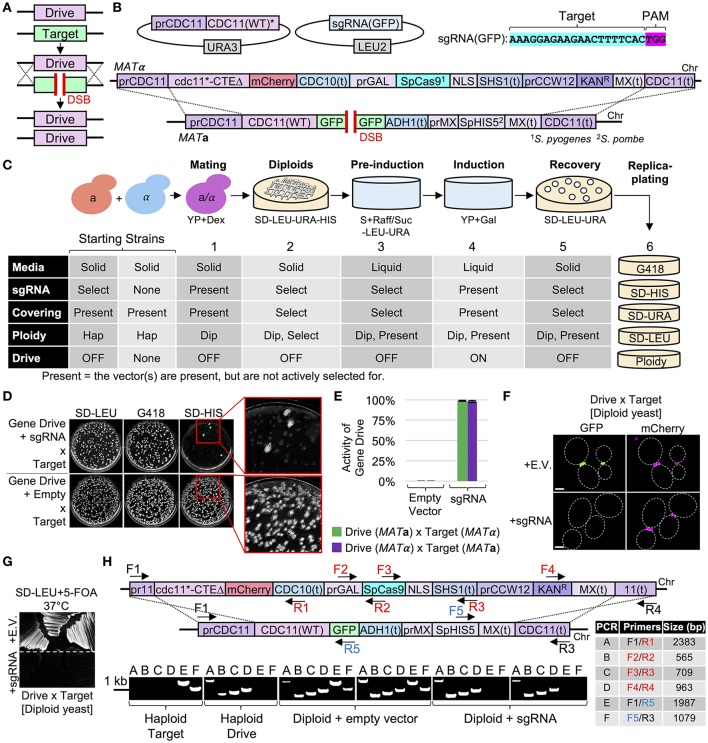
Use of a Cas9-based gene drive to deliver a recessive allele to a yeast library of the opposite mating type and convert to a homozygous diploid condition. (A) General strategy for a nuclease-based gene drive. The “drive” consists of Cas9 placed at (or replacing) an endogenous gene. When paired in a diploid cell, Cas9 is expressed and targeted by the sgRNA to the homologous WT gene creating a DSB. Alignment of the entire homologous chromosome serves as the source of donor DNA to copy the gene drive. (B) Design of a gene drive for a recessive allele of an essential gene (CDC11). A URA3-based covering vector (pGF-IVL1146) expressing a WT copy of CDC11 is present in the starting gene drive strain. Cas9 is under control of the GAL1/10 promoter and harbors a KanR marker; the entire array is integrated at the CDC11 locus. A “target” strain (CDC11-GFP(S65T) fusion and the SpHIS5 cassette) was generated. The sgRNA(GFP) plasmid (pGF-425+IVL1276) was transformed into the haploid gene drive strain (GFY-2442 or GFY-2440). (C) The status of each component (plasmids, ploidy, markers, drive activity, etc.) is listed for each step. For a detailed description of drive activation, see section Materials and Methods. (D) Assaying for marker status on G418 and SD-HIS media of active and non-active (empty vector) gene drive diploids. (E) Quantification of colonies from multiple diploid crosses (GFY-2624 × GFY-2440 and GFY-2625 × GFY-2442) in triplicate. The percentage of surviving colonies (n = 250–500) is illustrated as “drive activity.” Error, SD. (F) Diploids strains (D) were imaged by fluorescence microscopy. Dotted white lines, cell periphery. Scale bar, 3 μm. (G) Diploids (D) were selected on SD-LEU+5-FOA medium for 2 days at 37°C. (H) Diagnostic PCRs on diploids strains (D) (n = 2) and haploids strain controls (GFY-2624, “target” and GFY-2440, “drive”). Oligonucleotides (table) unique to the drive (red), target (blue), or both, (black) are shown (also see Table S1). Expected PCR sizes (bp) are illustrated.

