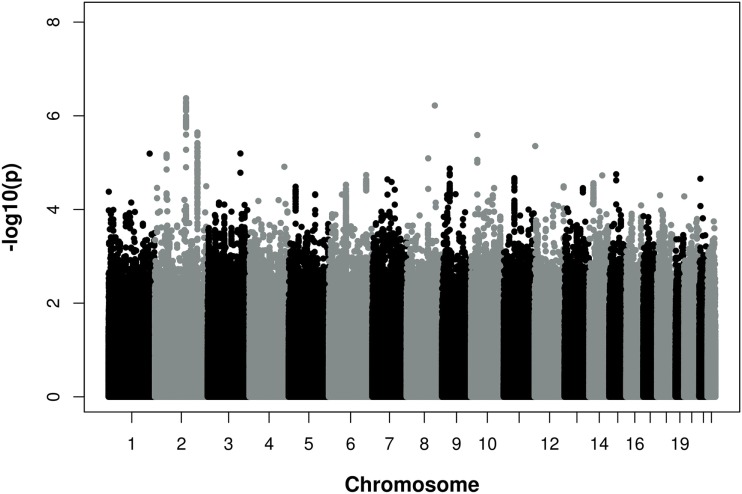
Figure 1.
Manhattan Plot of −log10 (p) for association of single nucleotide polymorphisms (SNPs) and chromosomal position for all autosomal SNPs analyzed in the meta-analysis of three independent discovery cohorts. Associations with a p–value <5 × 10⁻⁸ were considered genome-wide significant. The analysis was adjusted for age and gender.

