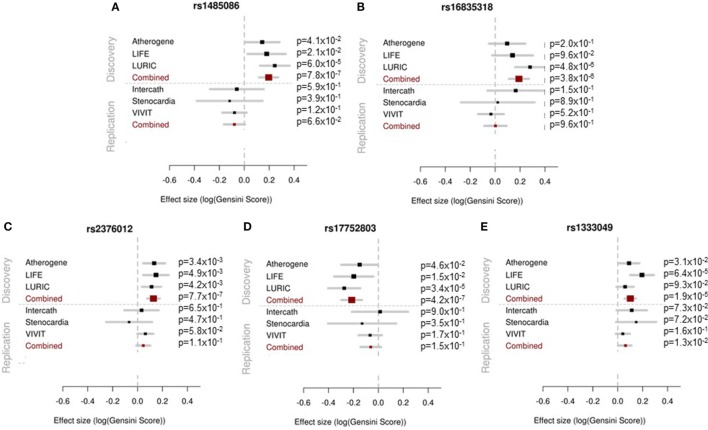
Figure 2.
Forest plots showing the results of the association analyses for each single study in the discovery (upper panel) and replication (lower panel) phase and for the meta-analysis are presented. The effect estimates and 95% confidence intervals are provided for each study separately and in combined analysis.

