
FIGURE 1.
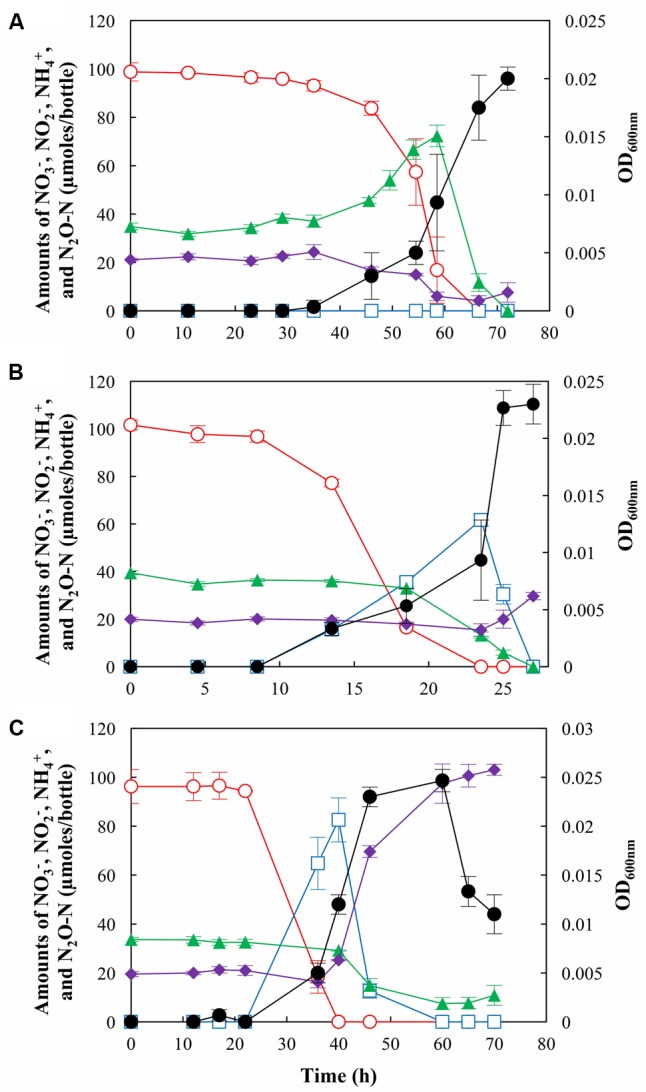
N2O production and/or consumption by Shewanella loihica strain PV-4 during reduction of NO3– at (A) pH 6.0, (B) pH 7.0, and (C) pH 8.0. The amounts of NO3– ( ), NO2– (
 ), NH4+ (
 ), and N2O-N (
 ) in the culture bottles were monitored until no more change was observed. The OD600
nm values (●) were measured to monitor the cell growth. The data points represent the averages of triplicate cultures and the error bars represent their standard deviations.
) in the culture bottles were monitored until no more change was observed. The OD600
nm values (●) were measured to monitor the cell growth. The data points represent the averages of triplicate cultures and the error bars represent their standard deviations.