
FIGURE 4.
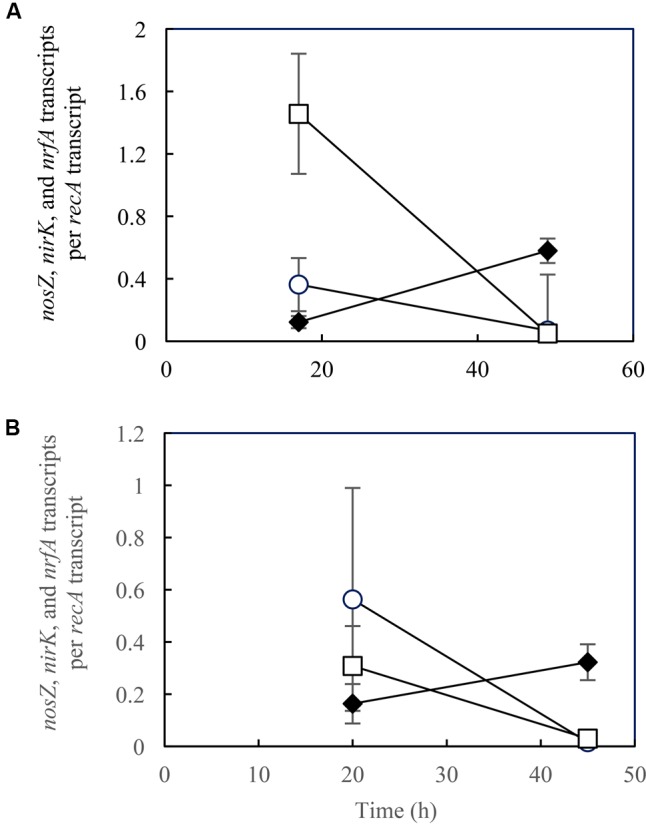
Transcription analyses of nosZ (○), nirK (□), and nrfA (♦) in Shewanella loihica strain PV-4 cells grown with NO2– and N2O at pH (A) 7.0, and (B) 8.0. RT-qPCR was performed with samples extracted from batch cultures at the exponential phase. The error bars represent the standard deviations of three biological replicates processed independently through RNA extraction, purification, and reverse transcription procedures.