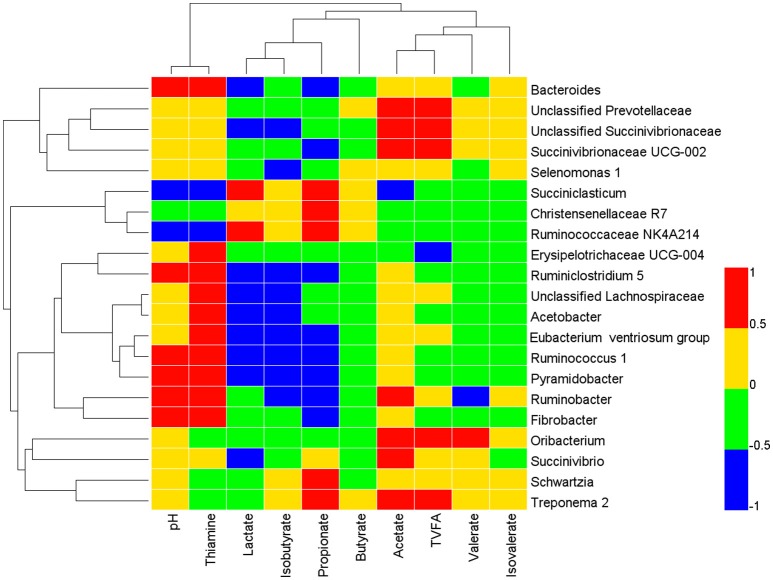
Figure 3.
Correlation analyses between relative abundances of bacteria genera, and ruminal fermentation parameters and thiamine status. Only the genera with abundance significantly associated with the ruminal VFA concentration, thiamine concentrations, and pH were presented. The blue represents a negative correlation between the abundance of the species and the VFA concentration (r < −0.55, P < 0.05), the red color represents a positive correlation (r > 0.55, P < 0.05), and the green and yellow shows that the correlation was not significant (−0.55 < r < 0.55, P > 0.05).

