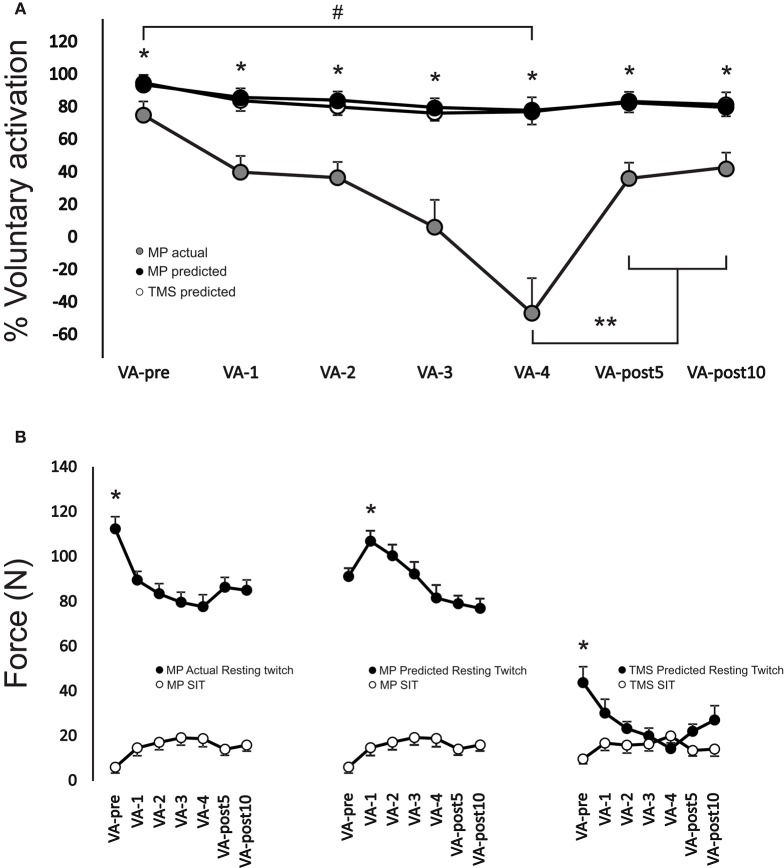
Figure 4.
(A) Change in voluntary activation during the MVC for each VA set from VA-pre to VA-post10. *Indicates a significant difference (p < 0.01) between TMS predicted compared to motor point actual and motor point predicted, **indicates a significant difference (p < 0.05) from VA-4 for TMS predicted only and # represents a significant main effect (p < 0.05) for time for VA-pre compared to VA-4. (B) Change in motor point actual, motor point predicted and TMS predicted resting potentiated twitch forces (black filled circles) and motor point and TMS evoked superimposed twitch forces (white filled circles) at 100% MVC. *Indicates a significant difference (p < 0.01) between VA-pre and all other time points for both motor point actual and TMS predicted and VA-1 and all other time points for motor point predicted resting potentiated twitch forces. All time points for motor point actual and motor point predicted resting potentiated twitch forces were significantly different (p < 0.01) than those of TMS predicted resting potentiated twitch forces (not symbols shown to denote difference). Each data point (A,B) represents the group mean ± SE.

