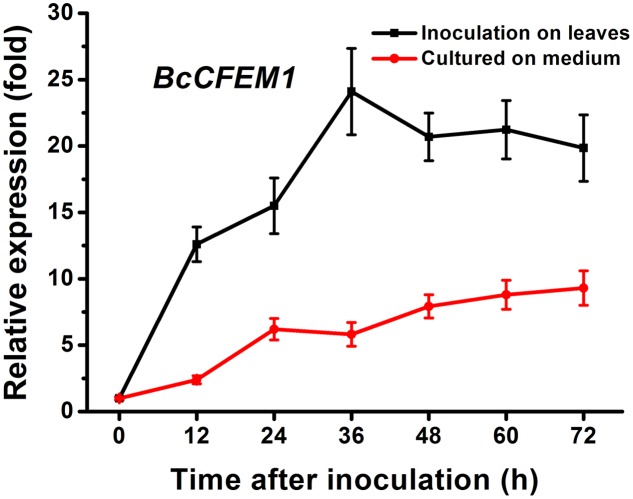
FIGURE 3.
The relative expression pattern of BcCFEM1 gene detected with qRT-PCR after growing on Gamborg’s B5 medium (red line) or inoculating on bean plants (dark line) for 0–72 h. The relative expression was calculated by the comparative Ct method. The BcCFEM1 expression level of B. cinerea inoculated on Gamborg’s B5 medium at 0 hpi was set as level 1. The transcript level of B. cinerea Bcgpdh gene (Ma et al., 2017) was used to normalize different samples. Data represent means and standard deviations (three independent replicates).

