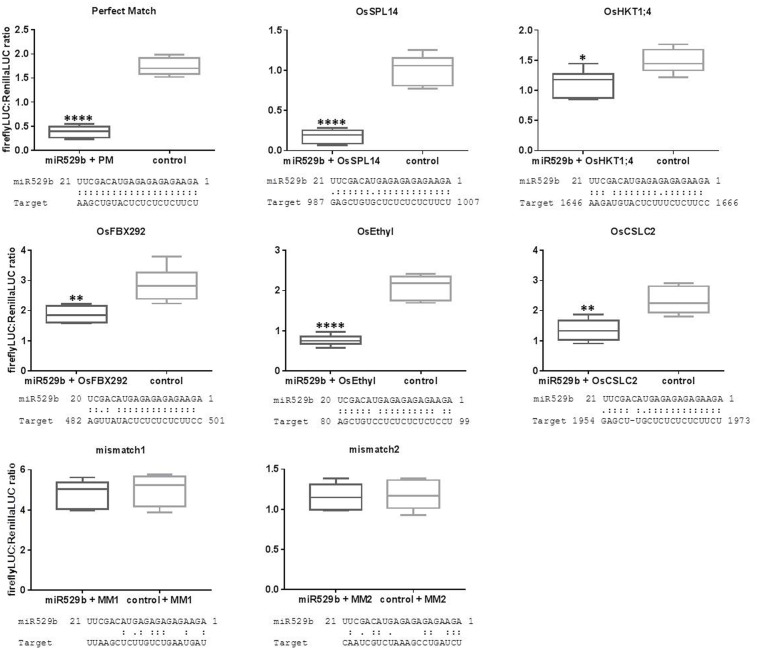
FIGURE 8.
Experimental validation of rice transcript sequences computationally predicted to be targeted by rice miR529b. Each control consists of assays where the miR529b precursor culture was replaced with a precursor construct culture that does not target the rice sequences. Mismatch1 (MM1) and mismatch2 (MM2) negative control assays use target sequences with little complementarity to the miR529b miRNA. The results are depicted as box and whisker plots, with interquartile range boxes and min/max whiskers (n = 6). Asterisk represents statistically significant differences using a simple two-tailed unpaired t-test with ∗P < 0.05, ∗∗P < 0.005, and ∗∗∗∗P < 0.0001.

