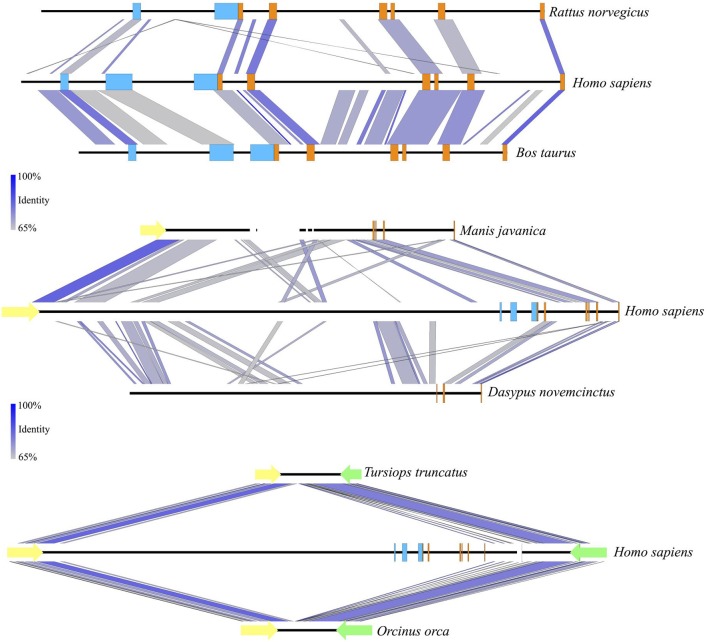
Figure 5.
Sequence identity comparisons of the UCP1 genes of the rat, cow, pangolin, armadillo, bottlenose dolphin, and killer whale vs. the human. All DNA sequences are shown 5′ (left) to 3′ (right). UCP1 exons 1–6 are denoted with orange rectangles while UCP1 upstream transcriptional regulatory elements are denoted in light blue (enhancer box, putative regulatory region, CpG island; from left to right). Gaps in sequence coverage are represented by white rectangles. Notably, the putative regulatory region is absent in the rat, but conserved in the cow. Upstream regulatory elements also appear to have been deleted in the Javan pangolin and armadillo, which have deletions of UCP1 exons 1–2, and 3–5, respectively. Deletion of the entire UCP1 gene between TBC1D9 (yellow arrows) and ELMOD2 (green arrows) has occurred in bottlenose dolphin and killer whale ~8–15 MYA (Gaudry et al., 2017) and included the upstream regulatory elements. Sequence identity percentage is represented with a color scale.

