
Figure 6.
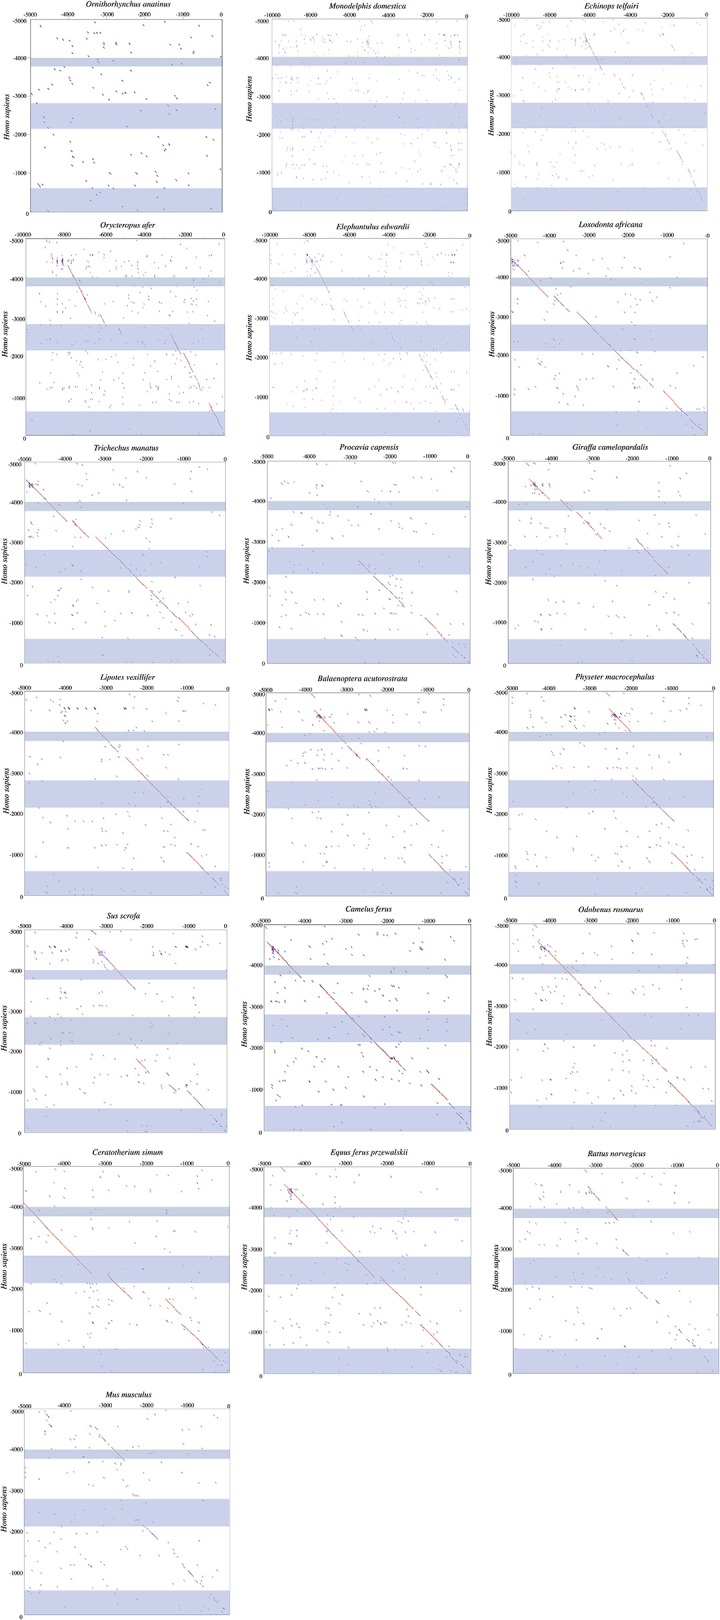
Dot plots of the 5,000 or 10,000 bp upstream of UCP1 exon 1 of select mammalian species compared to the upstream sequence of humans. Blue shading represents the UCP1 enhancer (~ −4,000 to −3,800 in human), putative regulatory region (~ −2,700 to −2,500 in human), and promoter/CpG island (−600 to 0 in human), in that order, from top to bottom.