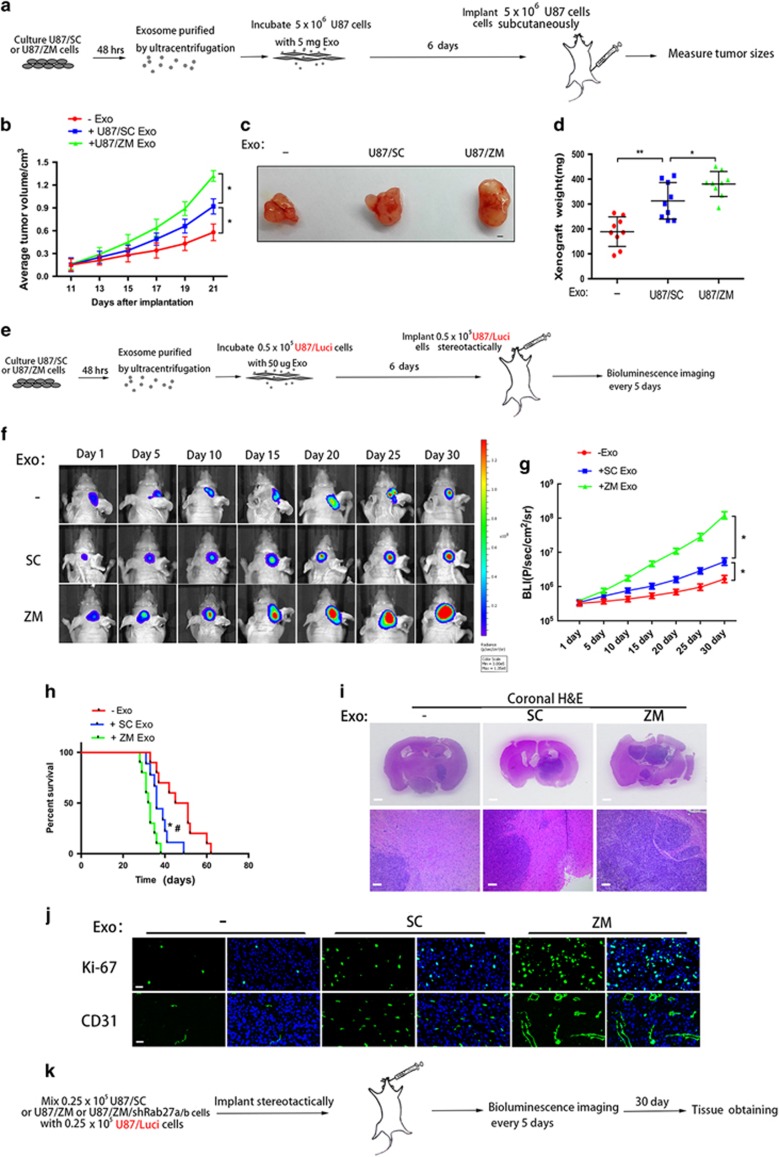
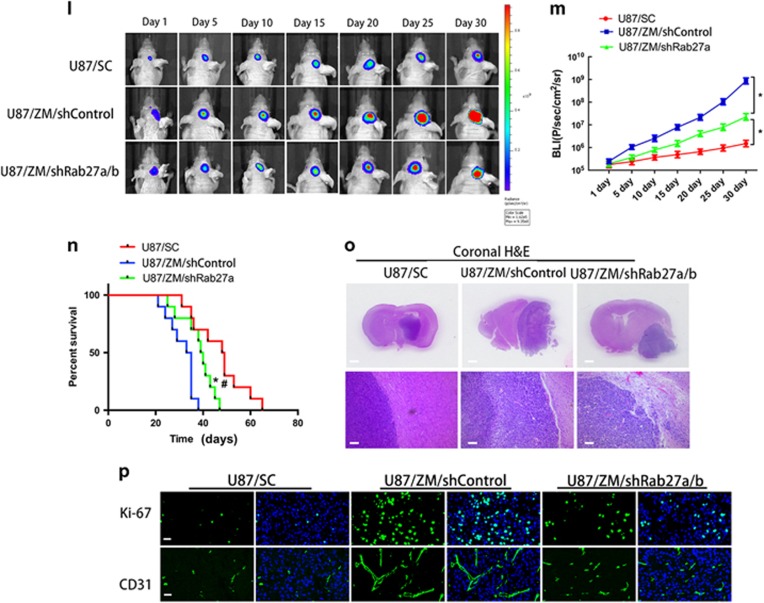
Figure 6.
ZM exosomes enhance GBM cell tumorigenicity, invasion and angiogenesis in vivo. (a) Schematic of in vivo tumorigenicity assay. (b–d) Effect of exosomes on the growth of U87 cells inoculated into BALB/c mice. Representative images of untreated (−) U87 cells or U87 cells cultured in the presence of ZM exosomes (ZM) or SC exosomes (SC) are shown. Scale bars=1 mm. (e) Schematic of in vivo tumorigenicity assay. (f) Representative images of mice harbouring intracranial U87 tumours on days 1, 5, 10, 15, 20, 25 and 30. The intracranially implanted U87 cells were untreated (−) or cultured in the presence of ZM exosomes (ZM) or SC exosomes (SC). (g) Activity plot obtained by bioluminescence imaging for intracranial tumours. (h) Kaplan–Meier survival curve of animals injected with untreated (−) U87 cells or U87 cells cultured in the presence of ZM exosomes (ZM) or SC exosomes (SC). *Significant difference compared to untreated cells, #significant difference compared to SC exosomes at P<0.05. (i) Representative haematoxylin–eosin (H&E) staining of tumour cytostructure and cytomorphology analysis in tumours. Scale bars=1 mm (top panels) and 100 mm (bottom panels). (j) Cell proliferation and angiogenesis in vivo were assessed by Ki-67 and CD31 immunostaining, respectively. Scale bars=25 μm. (k) Schematic showing the imaging of the in vivo tumorigenicity assay. Luminescence was measured to assess the tumorigenicity of the U87/Luci cells. (l) Representative luminescent images of mice after intracranial injection. (m) Activity plot generated by bioluminescence imaging of intracranial tumours. (n) Kaplan–Meier survival curve of animals injected with a mixture of U87/Luci cells and U87/SC, U87/ZM/shControl or U87/ZM/shRab27a/b cells. *Significant difference compared to U87/SC, #significant difference compared to U87/ZM/shRab27a/b cells at P<0.05. (o) Representative H&E staining of tumour cytostructure and cytomorphology analysis in tumours. Scale bars=1 mm (top panels) and 100 μm (bottom panels). (p) Cell proliferation and angiogenesis in vivo were assessed by Ki-67 and CD31 immunostaining, respectively. Scale bars=25 μm. Data are presented as the mean±s.d. from three independent experiments.


