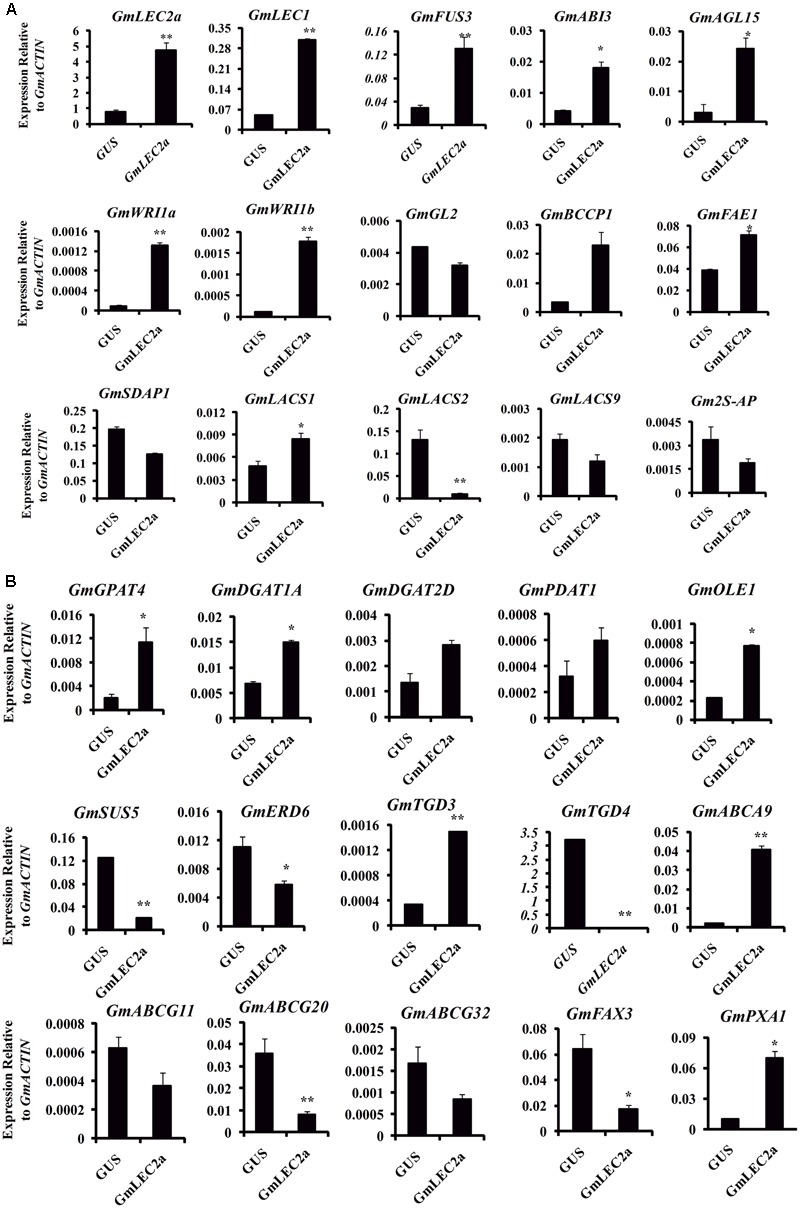
FIGURE 5.

Validation of transcriptomic data with qRT-PCR. (A) Verification of transcription factors and few transporters transcriptomic data with qRT-PCR. (B) Verification of transcriptomic data of genes involved in TAG, fatty acid, sucrose biosynthesis and transporters of fatty acid, wax with qRT-PCR. Transcript levels are expressed relatively to that of GmACTIN. All data are three biological replicates and are expressed as means ± SD. ∗∗P < 0.01 and ∗P < 0.05 by Student’s t-test (n = 3).
