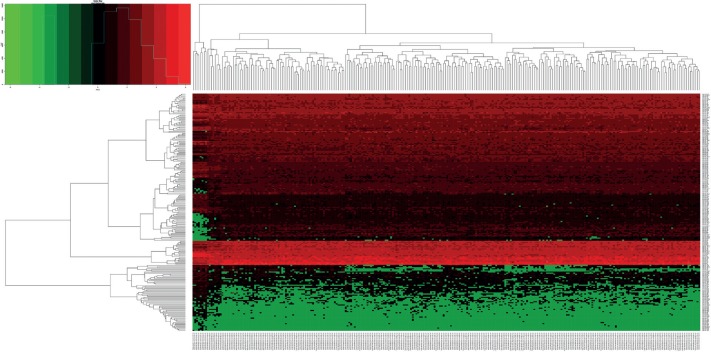
Fig. 6.
Heat map showing hierarchical gene clustering analysis of the differentially expressed microRNAs. Values used are normalised with log10. (The right longitudinal axis: the names of miRNAs, the left longitudinal axis: the clustering information of miRNAs, the upper abscissa axis: the clustering information of samples, the under abscissa axis: the sample code of cancer and normal. Red represents the up-regulated miRNAs while green represents the down-regulated miRNAs).

