. 2017 Sep 4;14(5):329–339. doi: 10.21873/cgp.20043

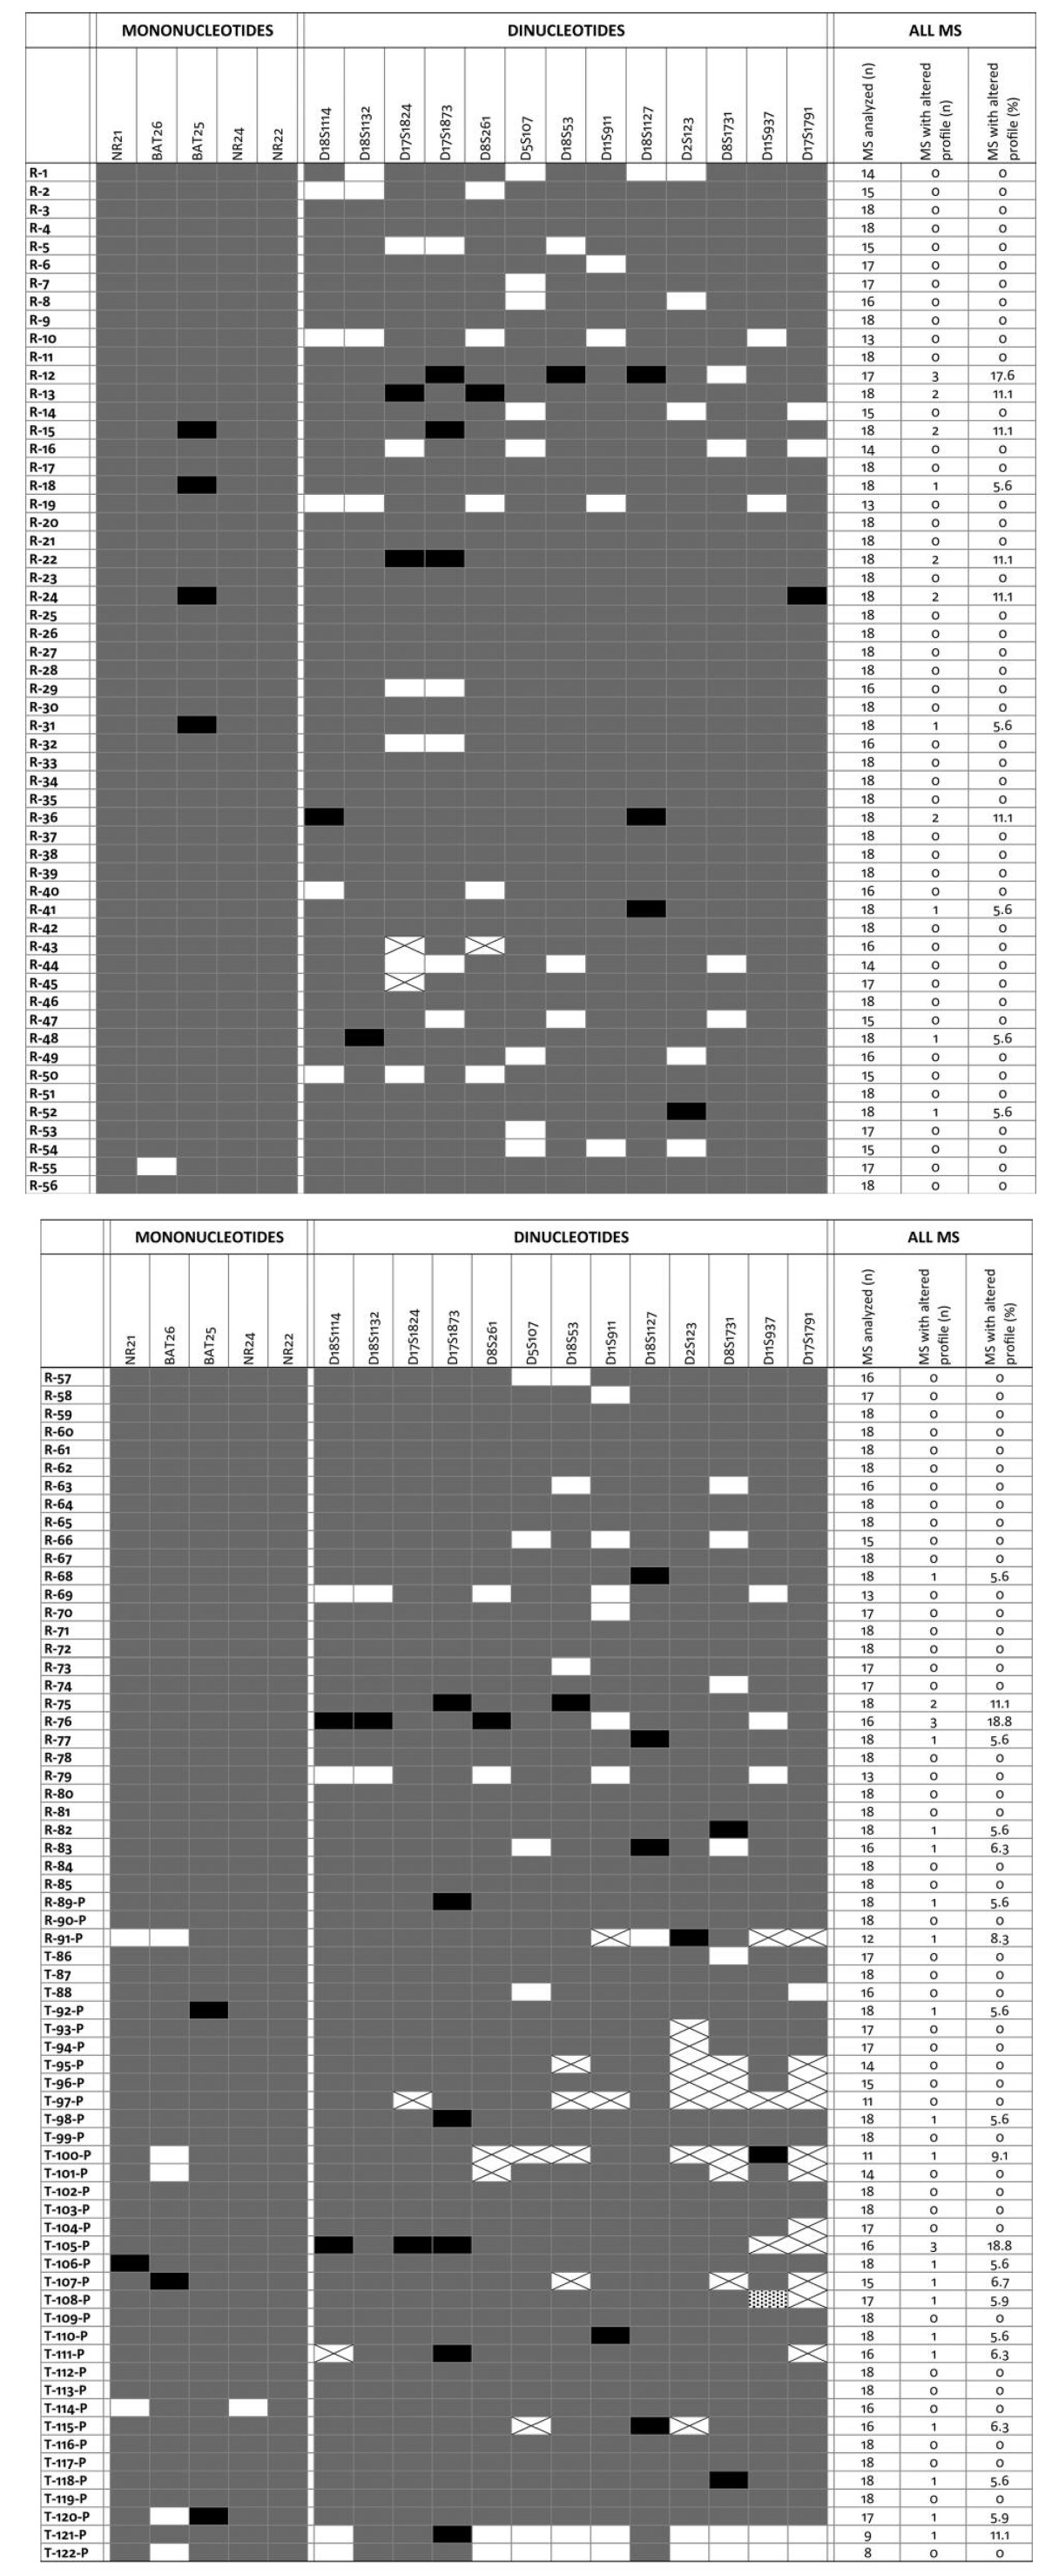
Table III. MS profiles in tumor samples of patients with hepatocellular carcinoma. Normal profiles are shown in grey, abnormal profiles are shown in black, rectangles with a cross indicate that DNA could not be amplified, open rectangles indicate samples that have not been investigated. For each tumor sample, the number of markers analyzed, the number of abnormal profiles and the percentage of abnormal profiles are indicated in the last three columns. Tumor identifiers in the left column start with an R or a T to indicate whether patient underwent tumor resection (R) or transplantation (T); a P at the end indicates paraffin-embedded samples. Abbreviation: MS, microsatellite.

graphic file with name cgp-14-334-i0001.jpg