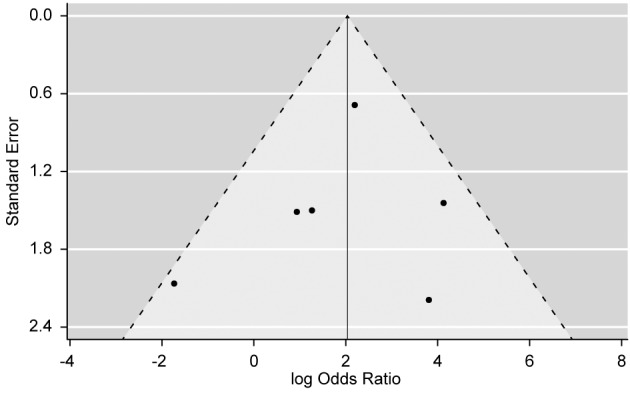
Figure 3. Funnel plot of the logarithm of the odds ratio with its corresponding standard error (Y-axis), where each black dot represents one of the six studies included in the meta-analysis, shows no apparent asymmetry would have indicated bias across studies. The absence of bias was formally confirmed using Egger’s test (p=0.679).

