. 2017 Sep 4;14(5):363–372. doi: 10.21873/cgp.20046

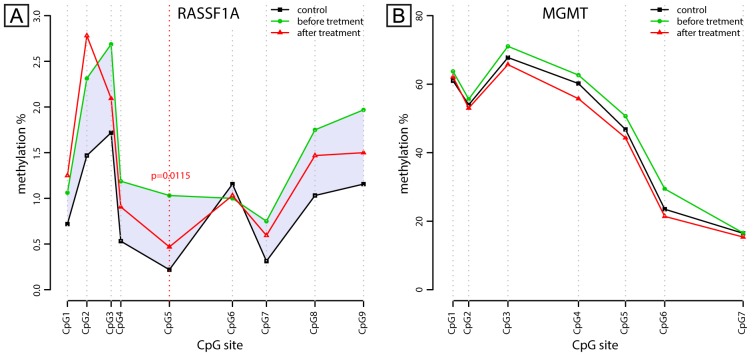
Figure 4. Methylation levels of the individual CpG sites within the RASSF1A (A) and MGMT (B) gene promoters. Methylation level is determined by pyrosequencing and is expressed here as a percentage. The distance between the CpG sites corresponds to their relative position within the analyzed DNA fragment. Points (triangle, circle and square) represent the mean methylation level for each group. Lines are drawn as a visual aid for illustrating the spatial organization of methylation levels along the analyzed region. A) The CpG sites 2, 3, 4, 5 and 7 in the analyzed fragment within the RASSF1A promoter show statistically significant difference between patients (before chemotherapy) and healthy controls. Methylation at the site CpG5 shows statistically significant difference (p=0.0115) between the patients before and after BEP chemotherapy (indicated by vertical dashed line). Shaded area emphasizes CpG methylation difference between healthy controls and testicular cancer patients. B) No significant difference was found in the MGMT promoter methylation.

Figure 4