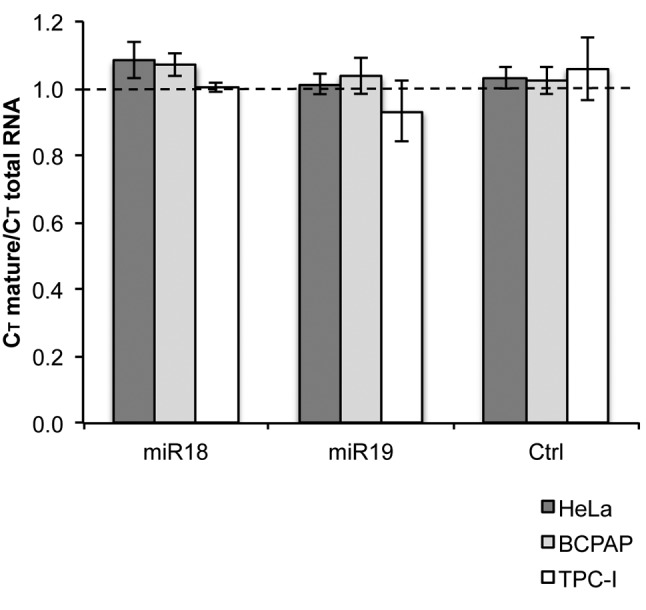
Figure 3. Splicing efficiency analysis using quantitative real-time reverse transcription–polymerase chain reaction. cDNA samples were derived from cells transfected with miR18a, miR19a or without miRNA (x-axis). Ratios higher than 1 (dashed line) indicate a lower amount of mature RNA, and therefore lower splicing efficiency.

