. 2017 Sep 4;14(5):389–401. doi: 10.21873/cgp.20049

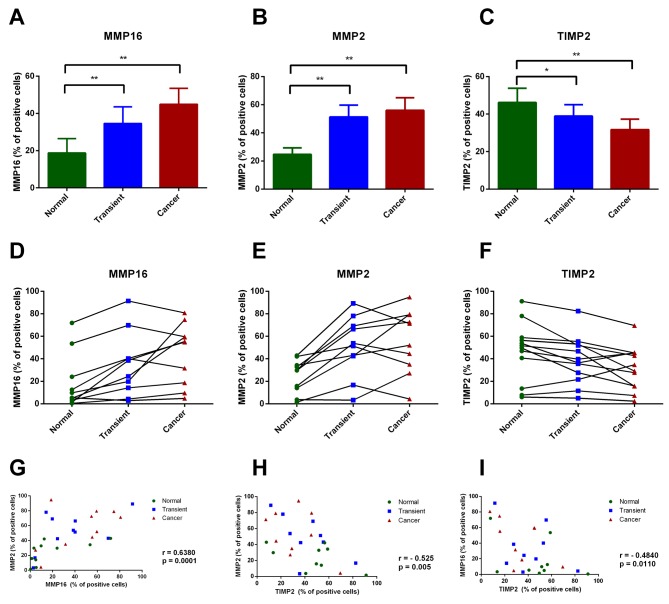
Figure 3. Immunohistochemical analysis of MMP16, MMP2 and TIMP2 expression in type-I endometrial cancer samples. (A-C) The percentage of MMP16, MMP2 and TIMP2 immunopositive cells in three pre-defined areas of histological sections: cancer tissue, transient zone and normal adjacent endometrium. The p-values were calculated using Wilcoxon signed-rank test: *p<0.05, **p<0.01, ***p<0.001. (D-F) The solid lines connect points representing IHC score of each zone from individual histological sections. (G-H) Scatter plots showing the correlation between analyzed proteins in examined samples. The correlation was calculated using Pearson’s coefficient.

Figure 3