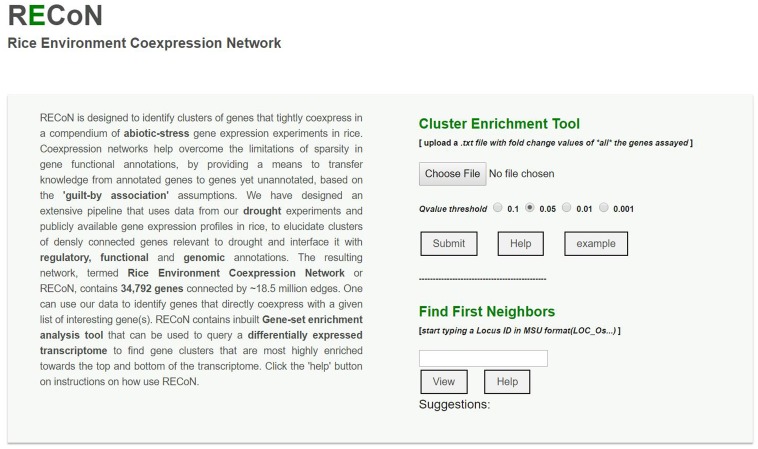
FIGURE 7.
A screenshot of the RECoN webserver available at the link provided in the main text. The online platform allows two types of analyses. The user can upload a genome-wide differential expression profile using the ‘choose file’ option, which will be used by the cluster enrichment tool to identify clusters that are significantly perturbed in the uploaded transcriptome, within the selected q-value threshold. The uploaded file should contain two columns (with headers) with MSU formatted rice gene locus IDs in the first column and their respective fold change values determined from the differential expression tests in the second column. The results will be displayed in a new page with enriched clusters listed and links to display each cluster using Cytoscape-web, as well as BPs and cis-regulatory elements (CREs) enriched in the clusters (see Supplementary Figures S2–S4). In cases where a single gene is of interest (rather than a genome-wide analysis), its locus ID can be entered in the input box under the ‘Find First Neighbors’ section. This analysis will report the genes within one path length of the query gene and a default coexpression score of 0.80 (which can be changed from the results page, see Supplementary Figure S5).

