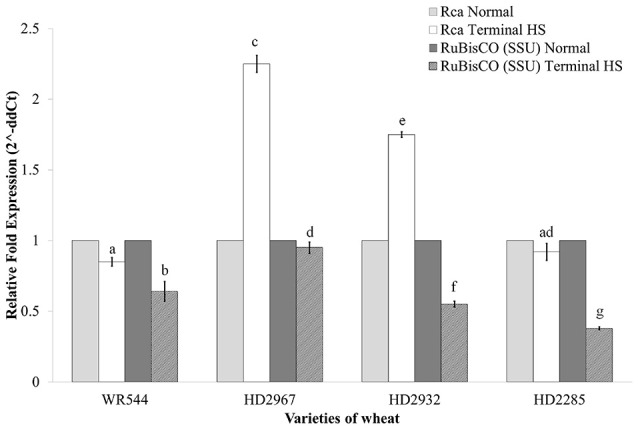
Figure 11.

Expression profiling of genes associated with photosynthesis in different genotypes of wheat under normal (26 ± 2°C) and terminal HS-treated (36 ± 2°C) conditions. RuBisCO and RuBisCO activase genes were used for the expression profiling; β- actin gene was used as endogenous control for normalizing the data; different letters above each bar indicate a significant difference (p < 0.05) between treatments (one-way ANOVA); Vertical bars indicate s.e (n = 3).
