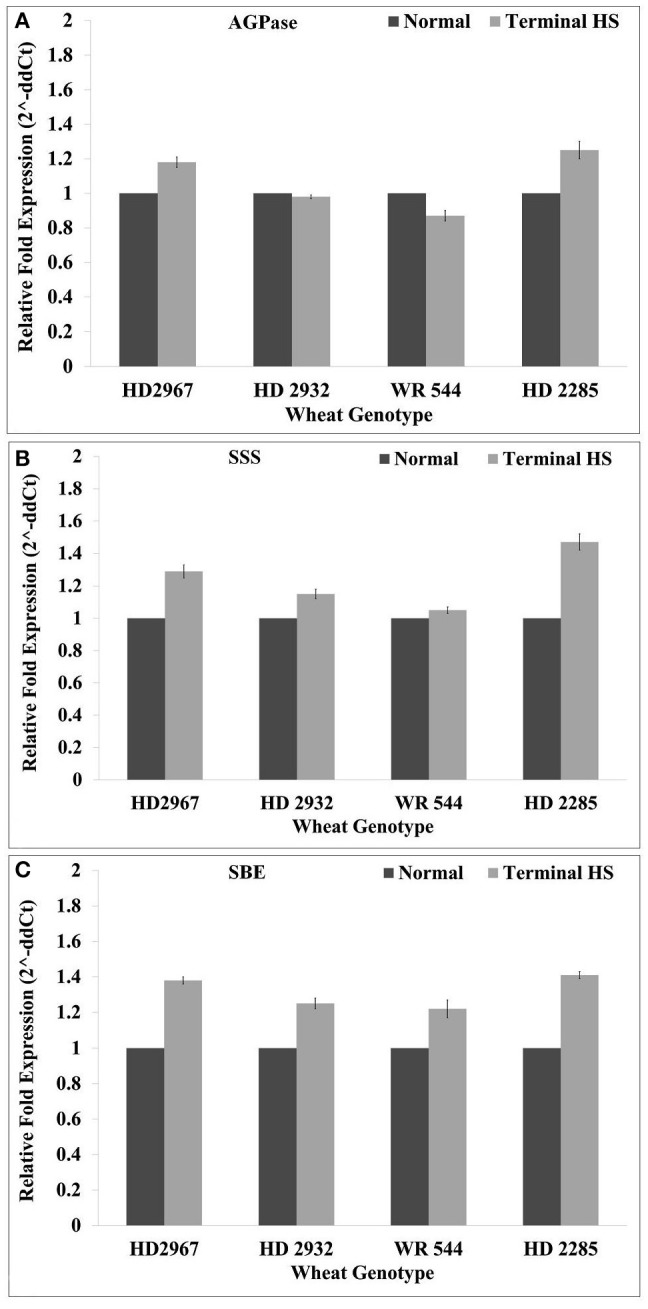
Figure 12.

Expression profiling of starch biosynthesis pathway-associated genes in different genotypes of wheat under normal (26 ± 2°C) and terminal HS-treated (36 ± 2°C) conditions. (A) Relative fold expression of AGPase, (B) relative fold expression of SSS, and (C) relative fold expression of SBE. ADP glucophosphorylase (AGPase) (acc. no. X66080.1), soluble starch synthase (SSS) (acc. no. KM206143) and starch branching enzyme (SBE) (acc. no. AF338432.1) were used for the expression profiling; β-actin gene was used as endogenous control for normalizing the data; Vertical bars indicate s.e (n = 3).
