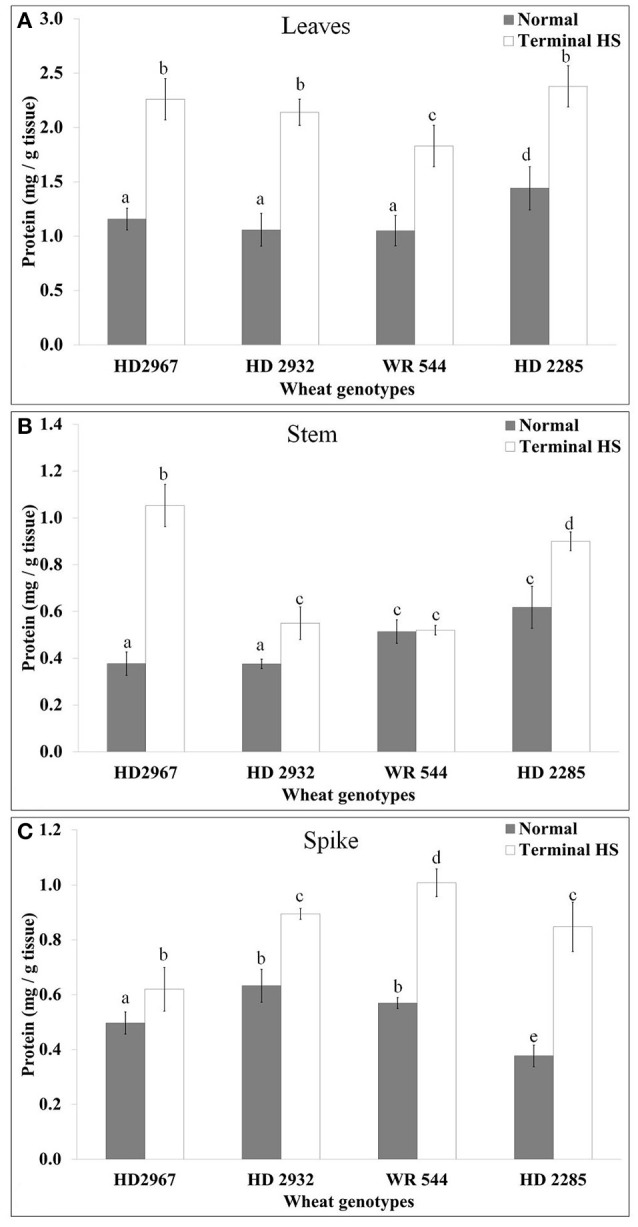
Figure 2.

Variations in the protein accumulation in different genotypes of wheat under normal (26 ± 2°C) and delayed-sown (36 ± 2°C) conditions in (A) Leaves, (B) Stem, and (C) Spike. Tissues collected during grain-filling stage were used for the protein estimation by Bradford method; different letters above each bar indicate a significant difference (p < 0.05) between treatments (one-way ANOVA); Vertical bars indicate s.e (n = 3).
