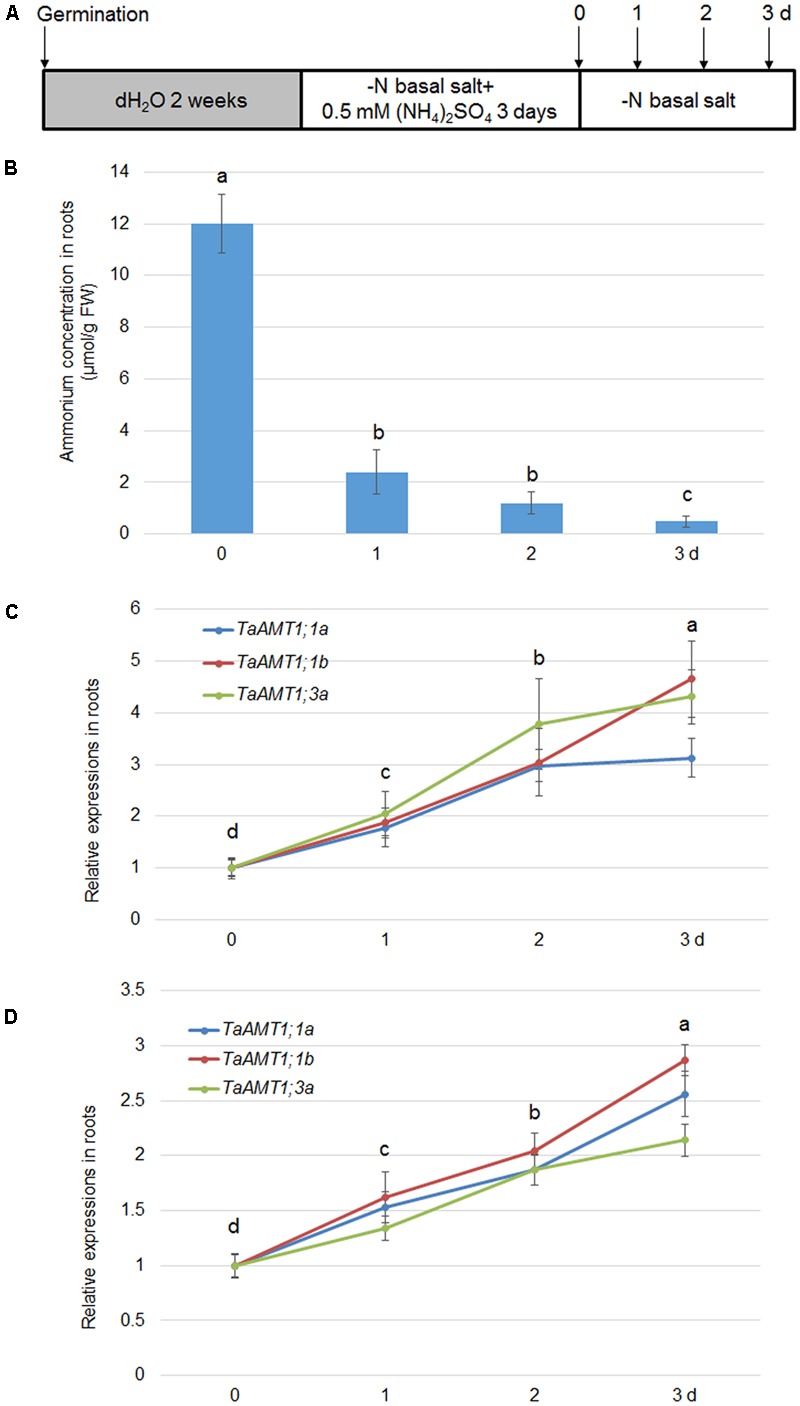
FIGURE 6.

Effect of N-deprivation on TaAMT1;1 gene expressions. For testing N-deprivation dependent gene expressions, the plants were grown as described in the section “Materials and Methods” (A). Endogenous levels measured in the roots of 17-day-old plants. Data represent means ± SE (n = 3) (B). The N-deficiency dependent expression of TaAMT1;1a, TaAMT1;1b, and TaAMT1;3a were analyzed in the roots (C) and leave (D) samples. Significant differences at P < 0.05 level are indicated by different letters.
