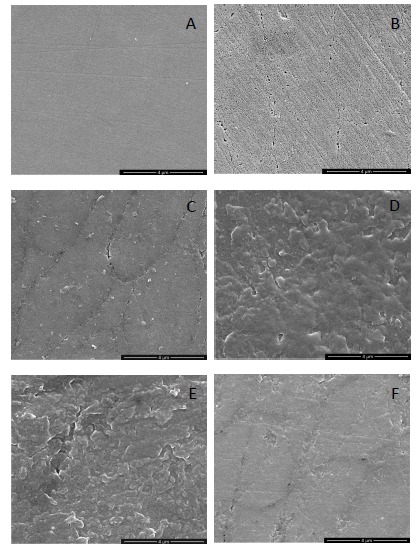
Fig. (5).
A. SEM images of the sound enamel (30 000×); B. SEM images of the enamel surfaces in DDW group (30 000×); C. SEM images of the enamel surfaces in NaF group (30 000×);D. SEM images of the enamel surfaces in GCE group (30 000×); E. SEM images of the enamel surfaces in eGCE group (30 000×);F. SEM images of the enamel surfaces in tannic acid group (30 000×).

