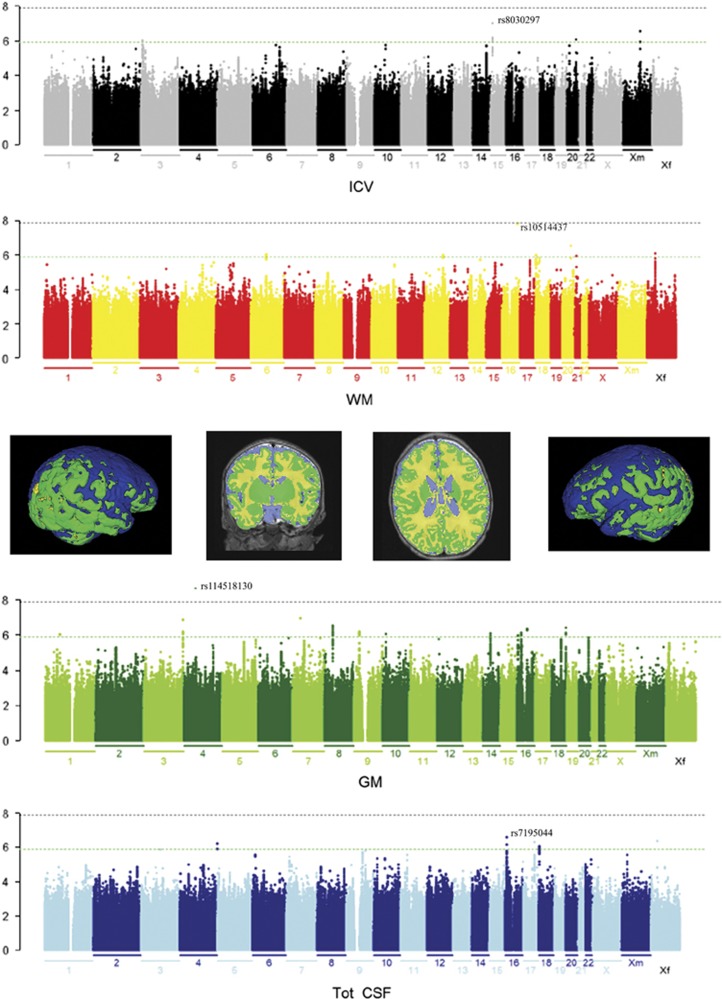
Figure 1.
Common genetic variants associated with infant brain volumes. Manhattan plots colored with a scheme that matches the corresponding tissue volume (middle) are shown (yellow is white matter (WM); green is gray matter (GM); blue is cerebrospinal fluid (CSF)). Genome-wide significance is shown for the threshold of P=1.25 × 10⁻⁸ (gray dotted line). The green line indicates the threshold of P=1.25 × 10⁻⁶. The most significant single-nucleotide polymorphism (SNP) for each phenotype is labeled.

