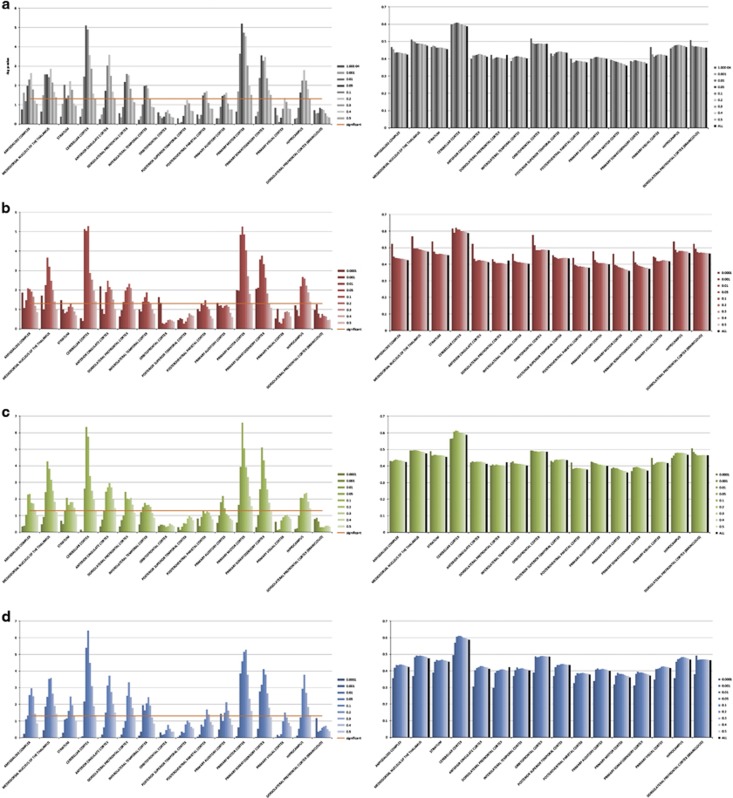
Figure 2.
Enrichment of prenatally expressed genes at multiple P-value thresholds. After LD-pruning, each single-nucleotide polymorphism (SNP) was assigned to the nearest gene within 2 megabases. Elevated prenatal expression was defined as a fetal/postnatal log2 fold-change threshold of 0.5. Analyses were performed using both the microarray-based ‘BrainCloud’ dorsolateral prefrontal cortex (DLPFC) transcriptome31 and the RNA sequencing-based Brainspan transcriptome of 15 different brain regions.32 Left panels show −log10 P-values. Orange line represents the threshold for statistical significance. Right panels show percentage of genes with elevated prenatal expression. (a) intracranial volume (ICV). (b) white matter (WM). (c) gray matter (GM). (d) CSF.

