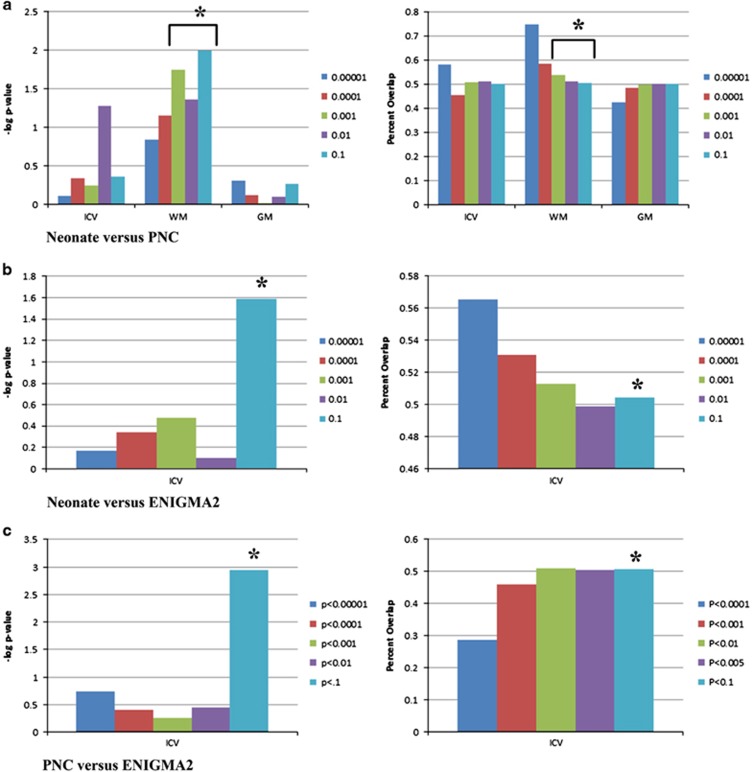
Figure 3.
Sign tests suggest minimal overlap between common variants impacting brain volumes in neonates, adolescents and adults. (a) Left panel shows –log10 P-values for two-sided exact binomial tests comparing single-nucleotide polymorphisms (SNPs) impacting intracranial volume (ICV) and ICV-adjusted white matter (WM) and gray matter (GM) in neonates to the same SNPs in adolescents (PNC). Right panel shows percent overlap. Tests for ICV-adjusted WM are significant (P=0.02, 0.04 and 0.01) at the thresholds of P<0.001, P<0.01, and P<0.1, respectively. (b) Left panel shows –log10P-values for two-sided exact binomial tests comparing SNPs impacting ICV in neonates to the same SNPs in adults (ENIGMA2). Right panel shows percent overlap. Test is significant at the threshold of P<0.1 (P=0.02). (c) Left panel shows –log10 P-values for two-sided exact binomial tests comparing SNPs impacting ICV in adolescents (PNC) to the same SNPs in adults (ENIGMA2). Right panel shows percent overlap. Test is significant at the threshold of P<0.1 (P=0.001). * indicates significance.

