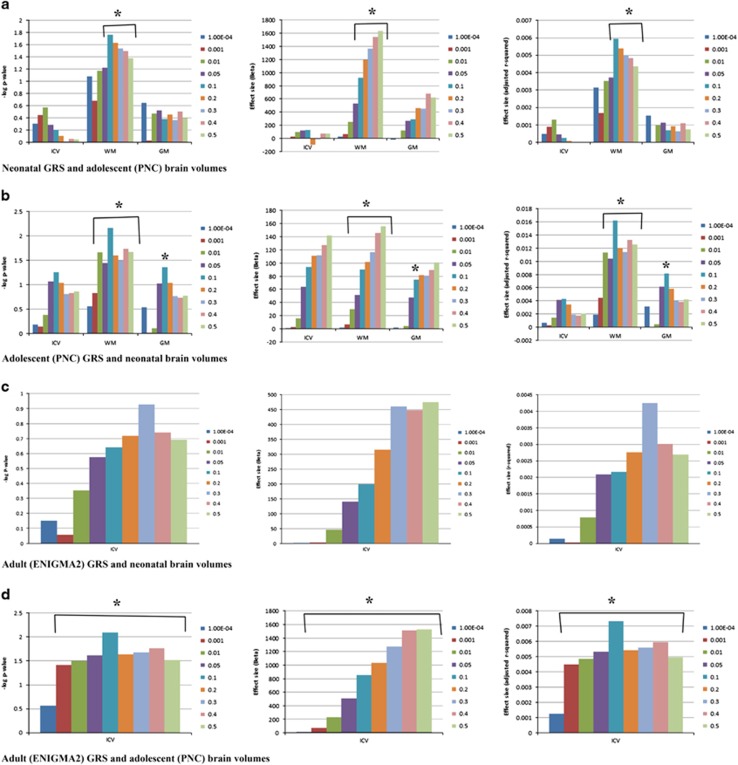
Figure 4.
Polygenic scores for neonatal, adolescent and adult brain volumes suggest genetic determinants of global brain volumes are highly distinct at different ages. (a) Left panel shows –log10 P-values for the association between neonatal polygenic scores for intracranial volume (ICV), ICV-adjusted white matter (WM), and ICV-adjusted gray matter (GM) and the matching phenotype in adolescents (PNC). Middle panel shows the effect size and direction of effect (Beta). Right panel shows the r2 value (percentage of variance explained after adjusting for covariates). (b) Left panel shows –log10 P-values for the association between adolescent polygenic scores for ICV, ICV-adjusted WM, and ICV-adjusted GM and the matching phenotype in this neonatal cohort. Middle panel shows the effect size and direction of effect (Beta). Right panel shows the r2 value (percentage of variance explained after adjusting for covariates). (c) Left panel shows –log10 P-values for the association between adult (ENIGMA2) polygenic scores for ICV and ICV in this neonatal cohort. Middle panel shows the effect size and direction of effect (Beta). Right panel shows the r2 value (percentage of variance explained after adjusting for covariates). (d) Left panel shows –log10 P-values for the association between adult (ENIGMA2) polygenic scores for ICV and ICV in adolescents (PNC). Middle panel shows the effect size and direction of effect (Beta). Right panel shows the r2 value (percentage of variance explained after adjusting for covariates).* indicates significance.

