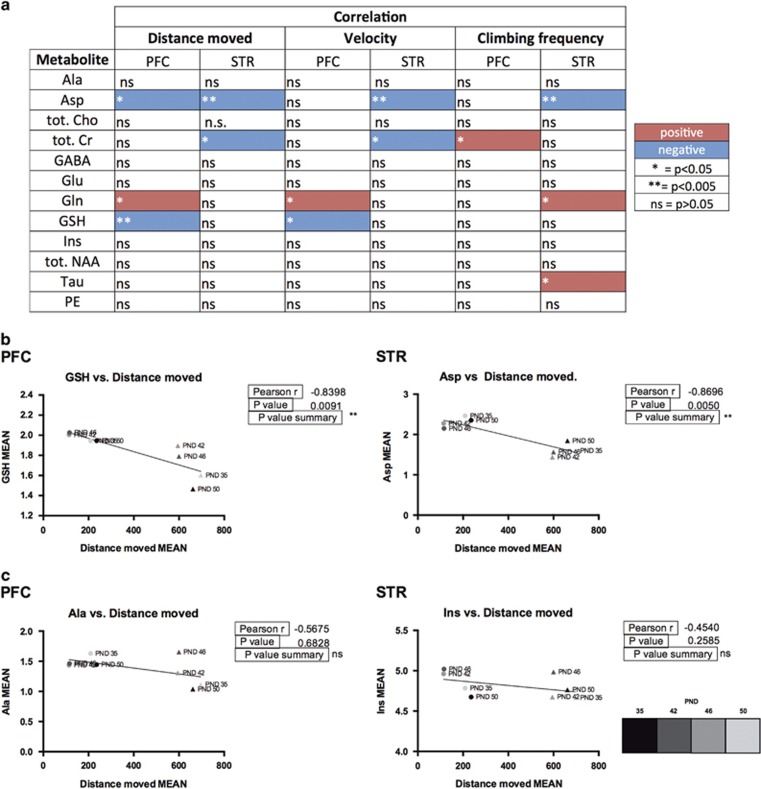
Figure 4.
Correlation overview. (a) List of the 1H-MRS detected 12 metabolites and their correlation values to mean distance moved, mean velocity and mean climbing frequency, sorted by brain region (PFC: prefrontal cortex; STR: striatum). Red and blue colors indicate positive and negative correlations respectively. Symbols legend: *P<0.05; **P<0.005; NS, P>0.05. (b) Representative graphs of the most significant metabolite correlations to distance moved, sorted by brain region. (c) Representative graph metabolites that do not significantly correlate to mean distance moved, sorted by brain region. WKY and SHR strains are indicated by circles and triangles respectively and colored in grey scale according to age. All mean values shown refer to the vehicle-treated groups.

