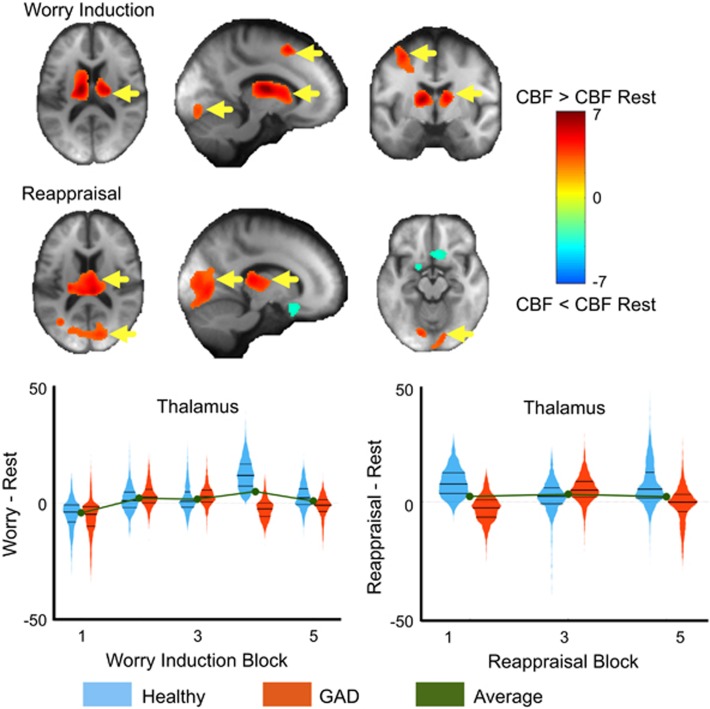
Figure 1.
Main effect of worry induction and reappraisal. Paired t-tests comparing the mean cerebral blood flow (CBF) during worry induction (top) and reappraisal (bottom) compared to resting CBF. Areas where CBF was greater during worry or reappraisal than rest are shown in red/warm colors and the reverse effect in blue/cool colors. The colors indicate T-statistics from the paired t-test. Yellow arrows indicate regions that survived multiple comparisons correction via a non-parametric method (SnPM). The thalamus is plotted across the five worry induction blocks as well as the three reappraisal blocks. Violin plots are the mirrored histograms of the entire voxel-wise data in that region (to show variation across voxels). Healthy participants are shown in blue and generalized anxiety disorder (GAD) in red. The average is shown in green. Note: Bilateral thalamus showed a significant block effect independent of group.

