FIGURE 2.

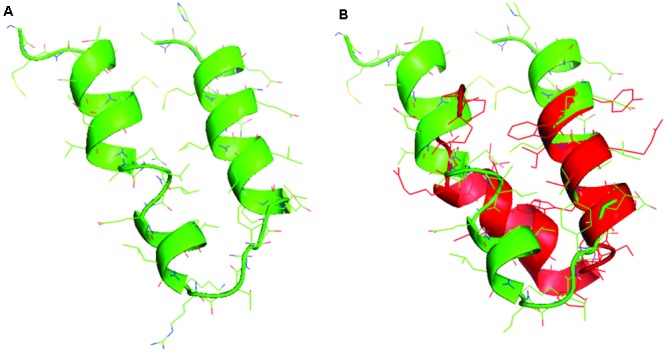
(A) The structural model for the control and (B) the structural alignment between the control (green) and the tRNA 3 model (red).

(A) The structural model for the control and (B) the structural alignment between the control (green) and the tRNA 3 model (red).