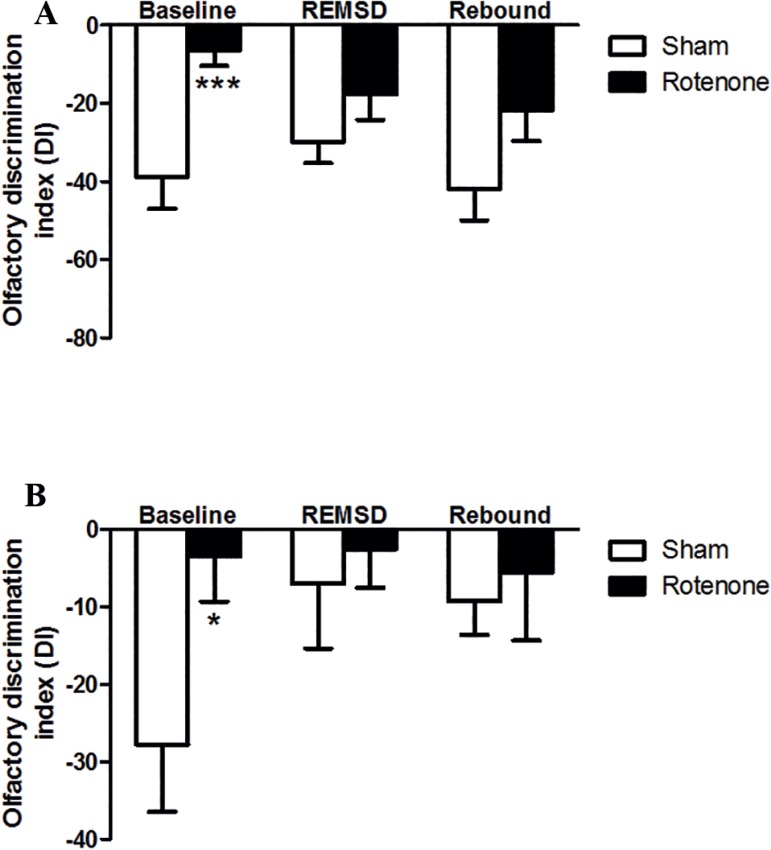
Figure 4.
Olfactory discrimination index (DI) obtained from 48 h of REMSD and 48 h of rebound. A. Social odor. B. Non-social odor (lemon). The bars represent the mean ± standard error of the mean, n=10 per group, *P≤0.05, **P≤0.01, ***P≤0.001 compared to the sham baseline. Two-way ANOVA followed by the Bonferroni test.

