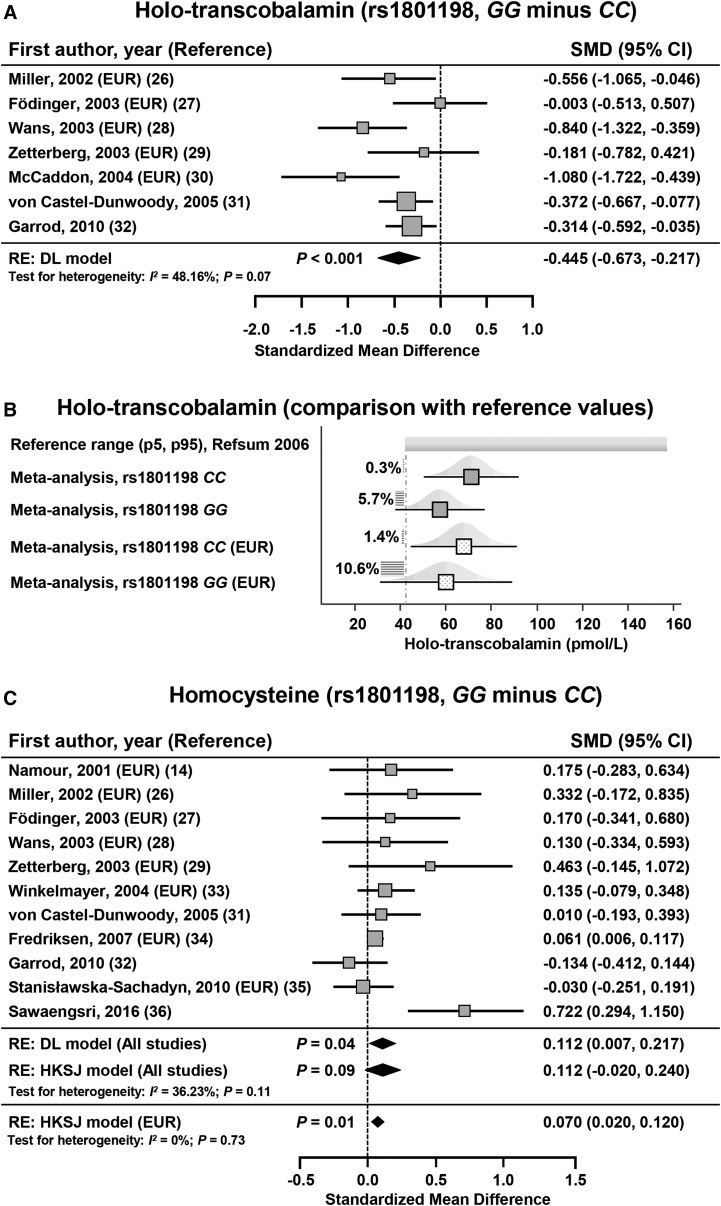
FIGURE 2.
SMD for holotranscobalamin between subjects with the GG and CC genotypes for rs1801198 (A). The calculated summary effects are denoted by the solid diamonds at the bottom of the forest plots, the widths of which represent the 95% CIs. (B) Pooled mean concentrations (95% CI) of holotranscobalamin in subjects with an rs1801198 CC or GG genotype. Pooled mean concentrations are also reported in European-ancestry subjects (EUR). The horizontal hatchings and corresponding percentages represent the probability of exhibiting a holotranscobalamin concentration less than the threshold of 42 pmol/L. (C) SMD for homocysteine between subjects with GG and CC genotypes for the rs1801198. When the P value that is associated with the DL model was between 0.01 and 0.05, the 95% CI of the pooled effect size and its associated P value were calculated with the use of the HKSJ (23). For each study, the gray box and the horizontal line denote the central value of the effect size and its 95% CI, respectively. DL, DerSimonian and Laird procedure; EUR, study that included European-descent subjects; HKSJ, Hartung-Knapp-Sidik-Jonkman procedure; p5, 5th percentile; p95, 95th percentile; RE, random-effects model; Refsum, reference 59; SMD, standardized mean difference.

