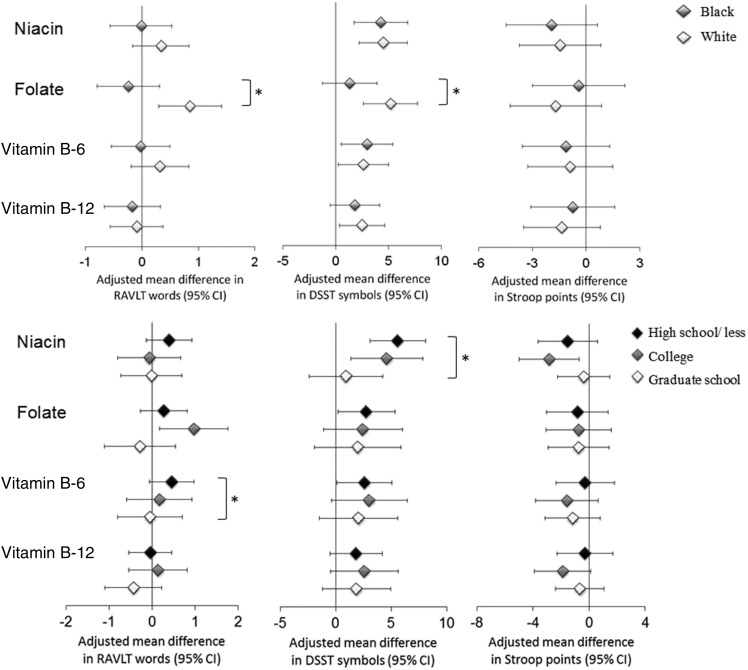
FIGURE 1.
Multivariable-adjusted mean differences (95% CIs) in cognitive test scores by race (upper panel) and education (lower panel) comparing quintile 5 with quintile 1 of cumulative daily total intake of B vitamins. Model adjusted for covariates listed in model 2 (see Table 2, footnote 1). *P-interaction < 0.05. DSST, Digit Symbol Substitution Test; RAVLT, Rey Auditory Verbal Learning Test.

