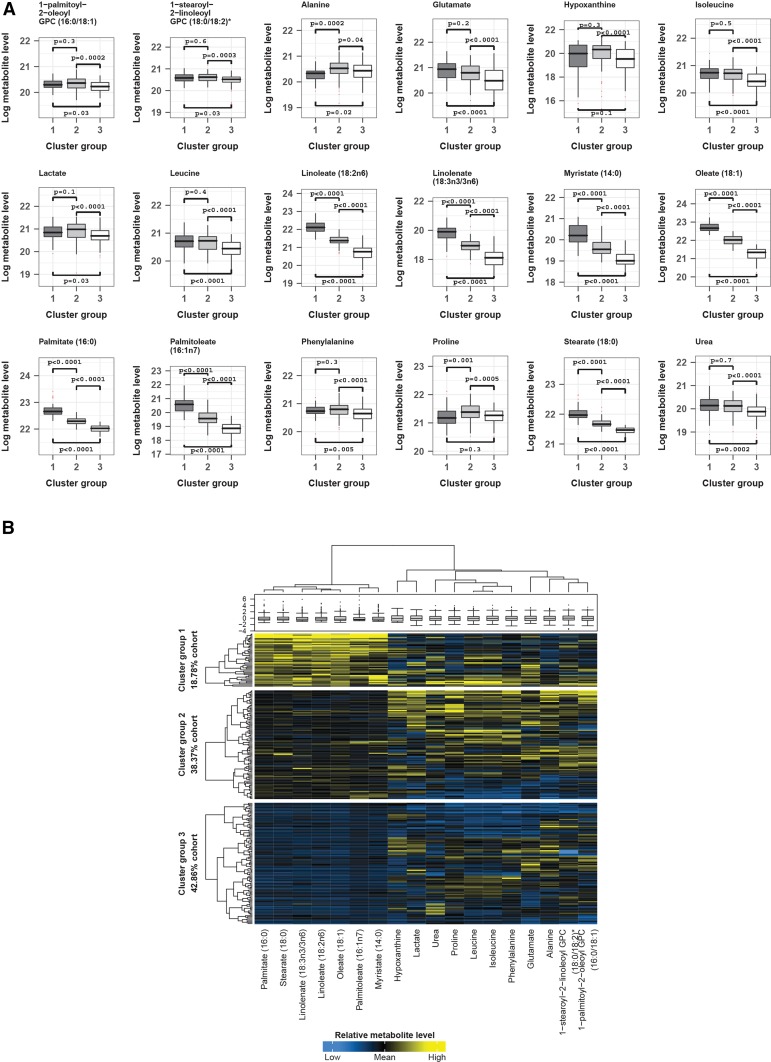
FIGURE 1.
Loge levels of metabolites across cluster groups highlights the main drivers of group segregation. Only metabolites identified as exhibiting variability across the identified cluster groups by medoid |z| >1 in the 3-cluster solution and that were additionally significant by Kruskal-Wallis P < 0.001 across these groups were chosen. Their natural log metabolite concentrations were plotted to reveal true patterns of similarity and difference across each group. (A) Box plots with pairwise group comparisons for each metabolite (Mann-Whitney U test). (B) Sample and metabolite cluster dendrograms with heat map and box plot of metabolite concentrations. Sample dendrogram and heat map divided by sample-to-cluster assignment. Total sample N = 245: group 1, 46; group 2, 94; group 3, 105. GPC, glycerophosphorylcholine.

