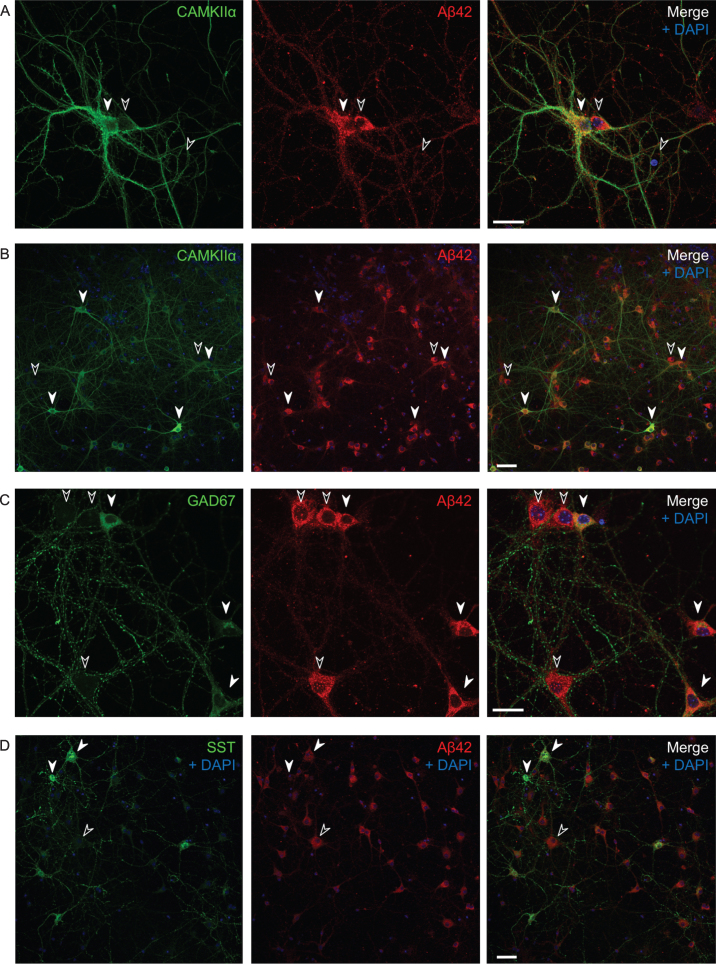
Fig.2.
Varying endogenous Aβ42 levels in AβPP/PS1 primary neurons in culture. Immunofluorescent labeling of AβPP/PS1 primary neurons. A, B) All CAMKIIα-positive cells (white filled arrows) have high levels of Aβ1 - 42; however, so do many, but not all, CAMKIIα-negative cells as well (black arrows). Also note that the two side by side neurons in (A) with varying levels of CAMKIIα (the positive to the left and the negative to the right) have comparable high levels of Aβ1 - 42. C, D) Many GAD67-positive neurons show high levels of Aβ42 (C), however, some somatostatin positive cells have lower levels of Aβ42 (D). Scale bars 25 μm (A and C) and 50 μm (B and D).

