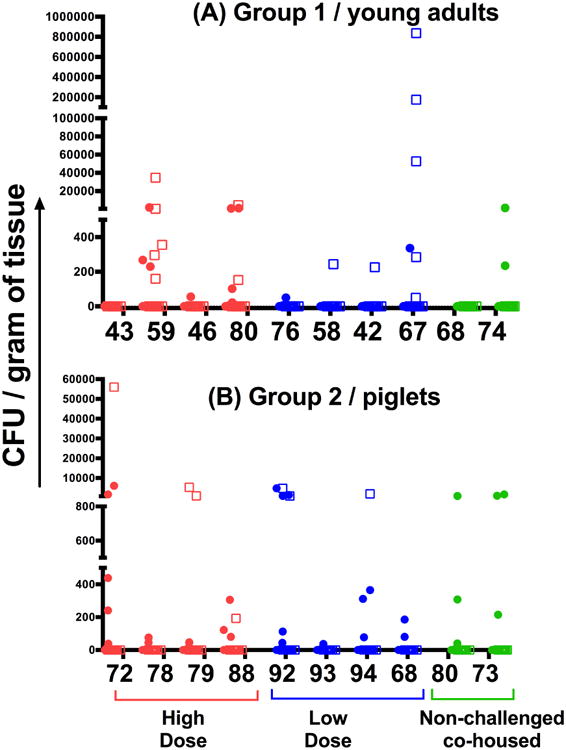
Figure 3. Bacterial burden.

Bacterial load in lung (circles) and lymph node (squares) samples. Tissue bacterial load from lesions from group 1 (top graph) and group 2 (lower graph) challenged with a high dose (HD; red) and low dose (LD; blue) aerosol of Mtb strain HN878, and from pigs left unchallenged (green) but co-housed with the challenged animals. Data is presented as the number of colony forming units (CFU) per gram of tissue obtained after plating serial dilutions of the sample homogenate onto 7H11 agar plates and incubating for 3-4 weeks at 37°C.
