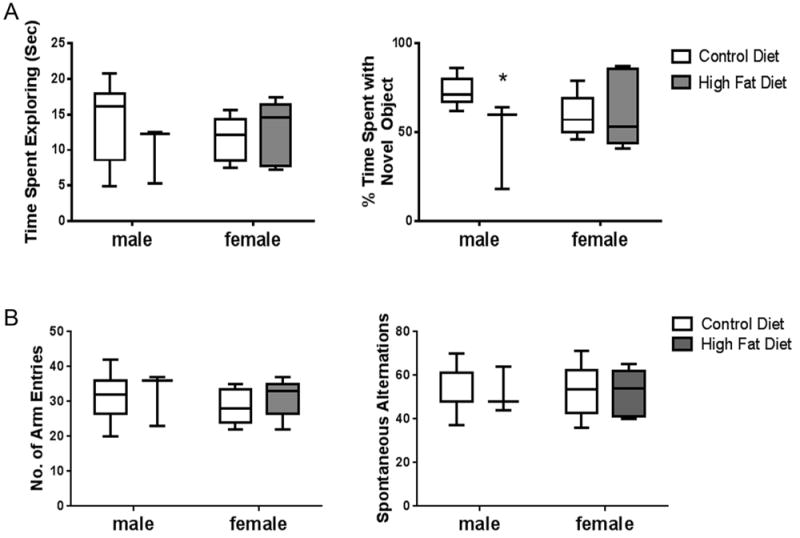
Fig. 5.

Novel object recognition and Y maze testing. Time spent exploring a novel object and percent of total time spent exploring a novel object were assessed as described in Section 2 (A). Number of arm entries and spontaneous alternations were measured for Y maze as described in Section 2 (B). Plot box indicates 25–75 percentile, line indicates median, and whiskers are minimum and maximum values. Data were analyzed by two-way ANOVA and no statistical differences were observed but multiple t-test indicated a difference between CD and HFD in males in % time spent with novel object, “*”statistically different than CD same sex, p < 0.05, n = 8–9.
